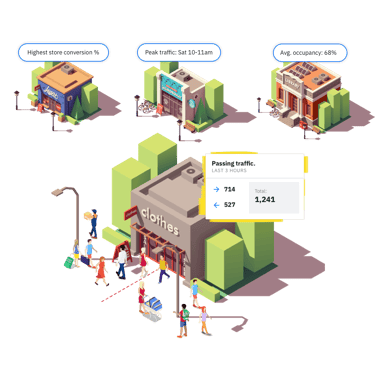
One of the biggest differences between optimization in online and physical retail spaces is the limitation of collecting and processing visitor and customer data. That being said, we all know how valuable insights from in-store footfall and conversion rates can be, with most retailers relying heavily on these metrics to make important operational decisions. However, what we have found overlooked is how combining in-store footfall data, street footfall data, along with sales metrics, allows retailers to produce a similar funnel-style view to that of an online store.
The Metrics
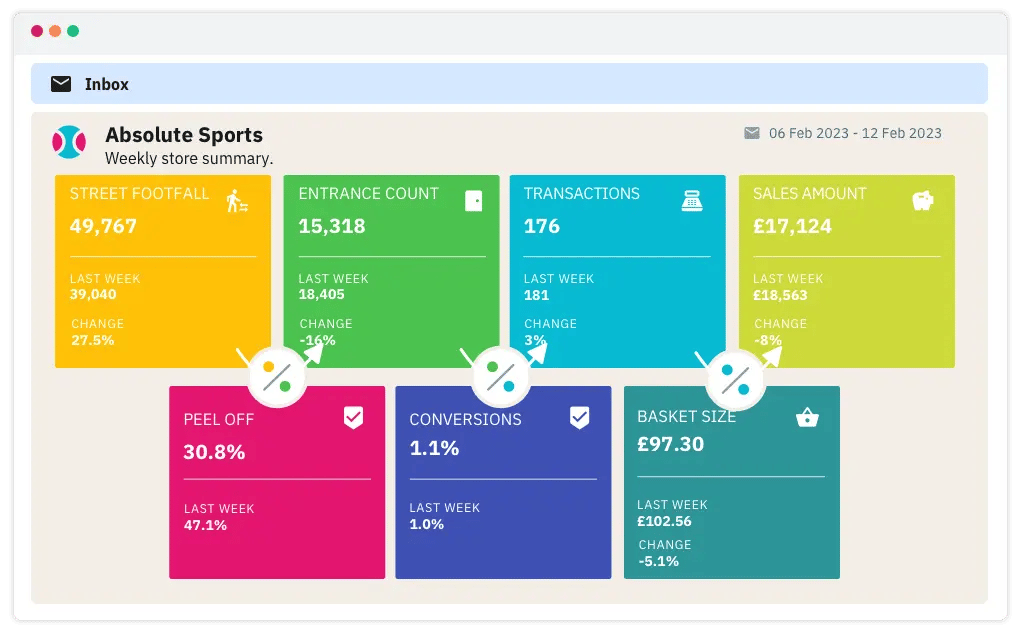
Let's quickly review the various elements we’ll be looking to combine to create our digital funnel. We start with in-store footfall, collected using a highly accurate camera-based system powered by artificial intelligence. This data, of course, is then combined with sales data and allows for the calculation of an in-store conversion rate, which I’m sure you’re already familiar with (if not click here to see our breakdown of conversion in retail).
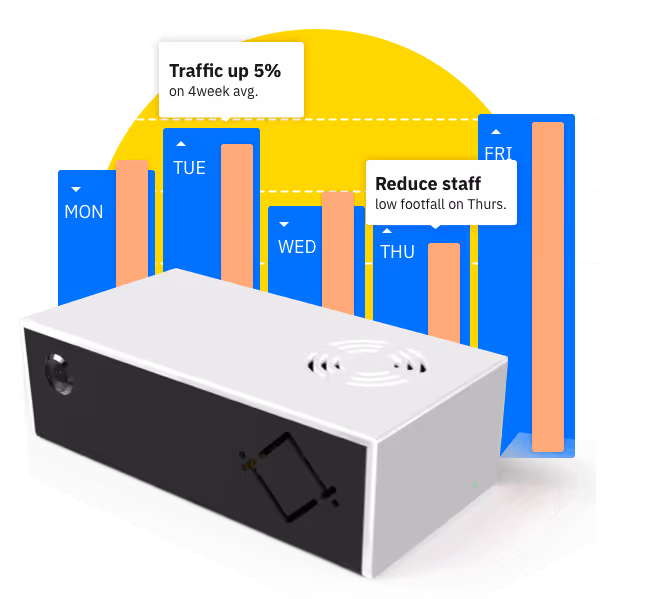
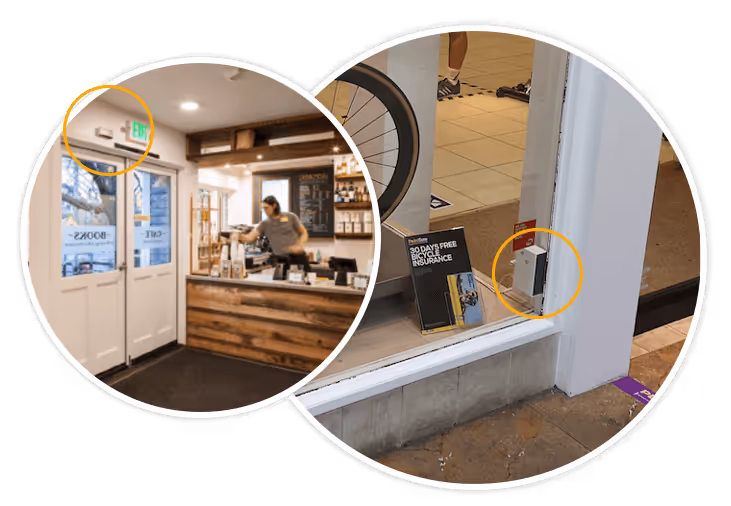
The next ingredient is street footfall data, collected by our globally patented side-firing cameras. These have many advantages over other collection methods such as superior accuracy to wifi-based systems and, when compared with aggregate footfall data that is sometimes provided at the street or shopping center level, they are able to continuously measure the number of people who pass by your specific store, thus better representing the opportunity you had to draw in potential customers.
Taking then both the in-store and street counts, we calculate a street-to-store conversion rate or ‘capture rate’. This can metric is especially useful if, among other things, you’re looking to drive footfall to your store we detail exactly why in this article, but in short it allows you to understand how well you’re location is converting passers-by into store visitors in a way that isn’t possible with footfall alone. The following article gives more information on how people count is used to improve store performance.
Lastly, we take again the number of sales and the revenue and calculate the average basket size which adds important context to the in-store conversion rate.
The Digital Funnel
Each of these metrics alone can of course be utilized to achieve help achieve a range of goals, but combining them is where we feel they really shine.
Now let's consider the journey of a prospective customer. First is the passerby who we want to draw into the store, here we look at street footfall and assess how well we’re converting passersby into visitors with our street-to-store conversion rate. Then once people are in-store we can use our in-store conversion rate to determine how the store as a whole is doing in converting visitors into paying customers. Lastly, we use the average basket value to see better understand the conversion rate and sales in relation to the revenue. At each critical point in the customer journey, we now have a clear metric to compare our performance. Their experience before they enter, while they’re in-store, and how much they spend.
By tracking and analyzing these metrics, we can begin to attempt to understand what might influence each stage of the funnel, helping us to improve, perhaps in areas in which our performance is less than satisfactory. Then, once we’ve taken action, we’re able to reliably assess the impact of our efforts.
For example, if a retailer has a low street-to-store conversion rate they may decide to refresh their window displays or run a local marketing campaign in an attempt to boost the proportion of people visiting the store and observe any change there might be in the capture rate following their action. Or if their in-store conversion rate seems to be lower than expected, they may choose to change some of the stock in the store or to provide additional training for the store's sales staff, this time observing the effect on the conversion rate. In general, having this digital view of the store's performance throughout the customer's journey has set up the framework for store optimization.
Unsurprisingly though, accounting for all these metrics can be complex and difficult to track, especially if the technology is split over a number of vendors or when looking at a collection of stores. With that in mind, in order to make this data easily comprehensible we’ve created a reporting system specifically designed to clearly present all the relevant data in this funnel view for each store individually or for analysis across a portfolio of stores. Ultimately ensuring both maximum visibility and maximum actionability of the data.