Before we get started, for a quick reminder of what 'people count' and 'footfall' mean, check out our article: An Introduction to People Counting in Retail.
What are footfall analytics?
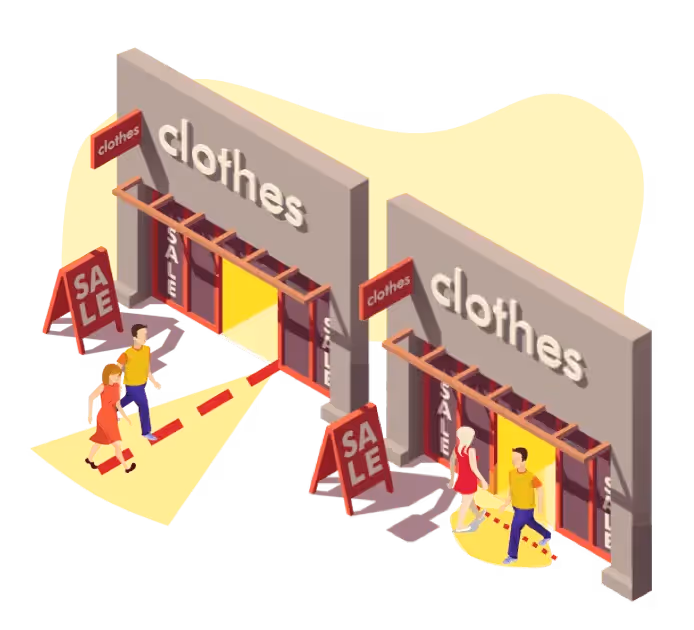
Operating retail stores is challenging, and the objectives of having stores has changed over the years. From a local stockist with a transactional focus, to a brand showcase: a place for the customer to feel the products, to identify with the retailer, and drive unique experiences and loyalty.
Here at HoxtonAi we work with cutting edge retailers, leveraging data and technology to measure progress through their sales funnel, and analyse what it means for their store operations.
It’s worth noting that store revenue is traditionally the golden metric for any store: the ultimate KPI. This can typically be analysed straight from the Point of Sale system. But the funnel leading up to the sale is harder to quantify, and if the location is used for showrooming and brand experience, sales may not be the only important metric. In this instance, there is value in the store in itself: and much like a TV ad or a billboard, this should be quantified, tracked and compared across locations.
Footfall data can be used as a practical KPI to give colour to the customer purchasing funnel, to baseline the store sales performance and drive best practice across a chain of stores.
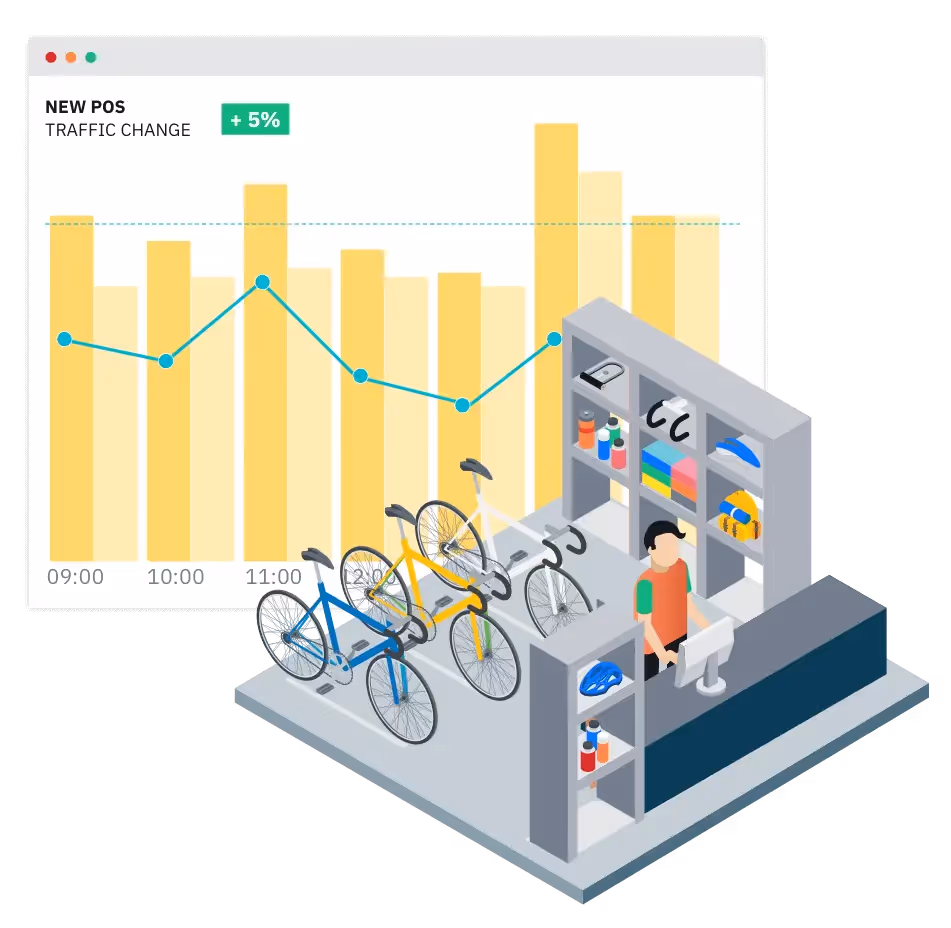
Combining store foot traffic with sales data and passing traffic.
There are three crucial datapoints to give a picture of the store performance:
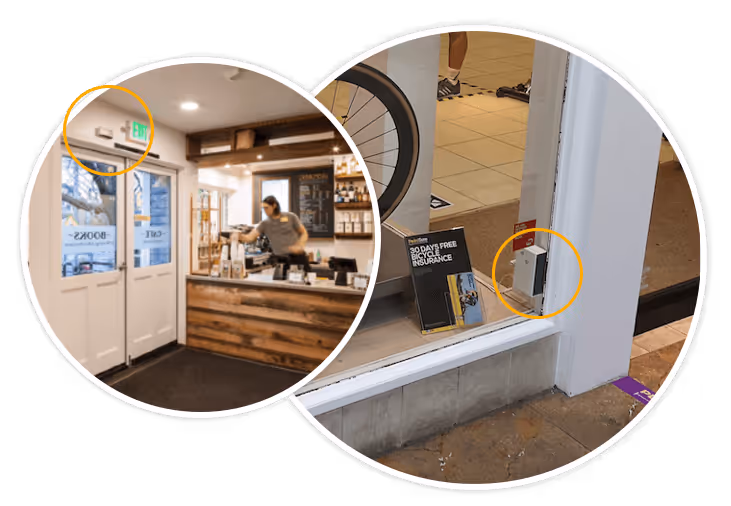
- The traffic passing outside the store – this represents the sales and marketing opportunity.
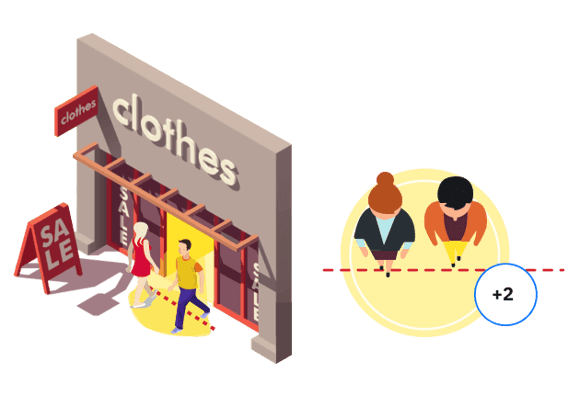
- The number of people who enter the store, the footfall.
- The Number and value of transactions from the POS system.
As well as these standalone metrics, they can be combined to calculate two new metrics:
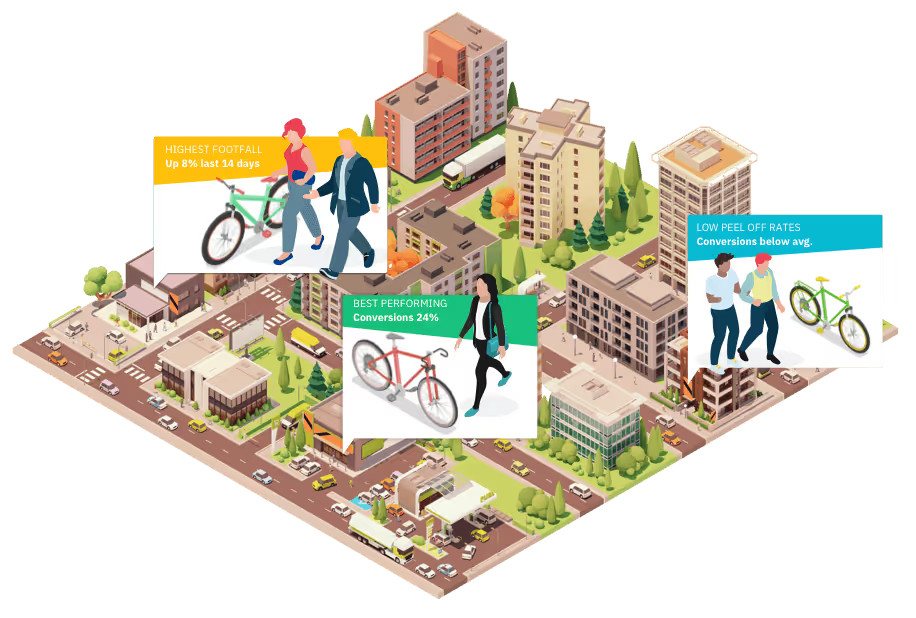
- The capture rate. This is the number of people walking in the store, as a proportion of people walking past. This is an indication of how well the location and marketing is attracting passers-by into the store.
- The conversion rate. This is the ratio of people who come in to the store, that then purchase a product. This is an indicator of how well customers who enter the store are compelled to purchase, reflecting the impact of the sales team, the product mix and in-store merchandising.
These three standalone and two calculated KPIs together paint a picture of the full street-to-store sales funnel. Over time, these can be used to drive performance in the store operations, including staffing, sales and marketing. By breaking down and focussing on just one part of the street-to-store funnel, we can gain an insight into each one of these.
1) Opening times
If you are able to flex opening times, there could be great efficiencies to be had by matching your store opening hours to the peaks and troughs of traffic outside. However, not all traffic is the same – consideration should also be given to your in-store count and conversion, to make sure the crowd that walks past is the right target for your business.
For example, the 8am commuter crowd is a valuable customer to a coffee shop, but worth very little to a luxury luggage store.
2) Evaluate marketing efficacy (e.g. digital and window displays)
Measuring the impact of window displays is fraught with risk. The ideal metric would be a clean A/B test, to compare street-to-store capture rates from one display to another. However, unless the display is entirely digital in nature, this is almost impossible.
As such, we recommend taking a longer amount of time – 2 to 4 weeks at least – and to see if there are changes in the proportion of store traffic that enters the store. Ideally, you would set up multiple types of new window displays in other stores, and measure the impact.
If all of the stores – regardless of window displays – are performing better, you may have caught a trend, or launched a fantastic blanked marketing campaign.
If there are clear differences in capture rate and conversion rates between one window display and another, then you have a new benchmark for best practice, and can use that new information to drive incremental value across all your stores.
3) Optimize staff rotas
The primary danger when understaffing, is to miss out on sales because a customer enters a store, is unable to speak to a staff member, and the sale is lost.
This can be seen clearly in the data. When there are peaks in store occupancy, many people are in the store at the same time, we often see a simultaneous reduction in conversion rates – i.e. fewer people as a proportion go on to buy something.
If this trend repeats itself – for example each Saturday afternoon – then adjusting rotas to reflect this could transform sales in those periods. To track this, keep on top of the data, and you may see that the conversion rate no longer dips during high occupancy. From here, you can make a clear RoI case for the extra staffing at peak times.
4) Track sales staff performance
Throughcomparing conversion rates across stores, you will get a good sense for which stores are doing well in converting the traffic. However, depending on the kind of store and the location, this may not be easily attributable to – for example – sales excellence in one store or another.
One way to determine what impact sales excellence and training is having, is to test the same two sales teams or salespeople across two stores. In doing this a few times, the data will reveal whether more conversions are happening when sales team A are in the store, as opposed to sales team B.
Of course, the benefit to this analysis could be transformative – the learnings from Team A may be trained and learned by the remaining salespeople in the business, driving best practice and marginal sales across all stores.
Conclusion
In this blog post, we’ve set out some of the primary and secondary metrics used by retail stores – from passing traffic, footfall, sales and conversion metrics. From our experience working with retailers, we’ve also suggested how these metrics can be used in retail stores – some simple, and some requiring a little more analysis and planning. Done correctly, each one can offer a transformative impact on retail businesses.