Key performance indicators (KPIs) for retail are the metrics that tell you whether your physical stores are performing well — and, crucially, why. Online retailers track conversion rates, traffic sources, and basket sizes in granular detail. But for physical stores, many of these metrics have historically been harder to measure.
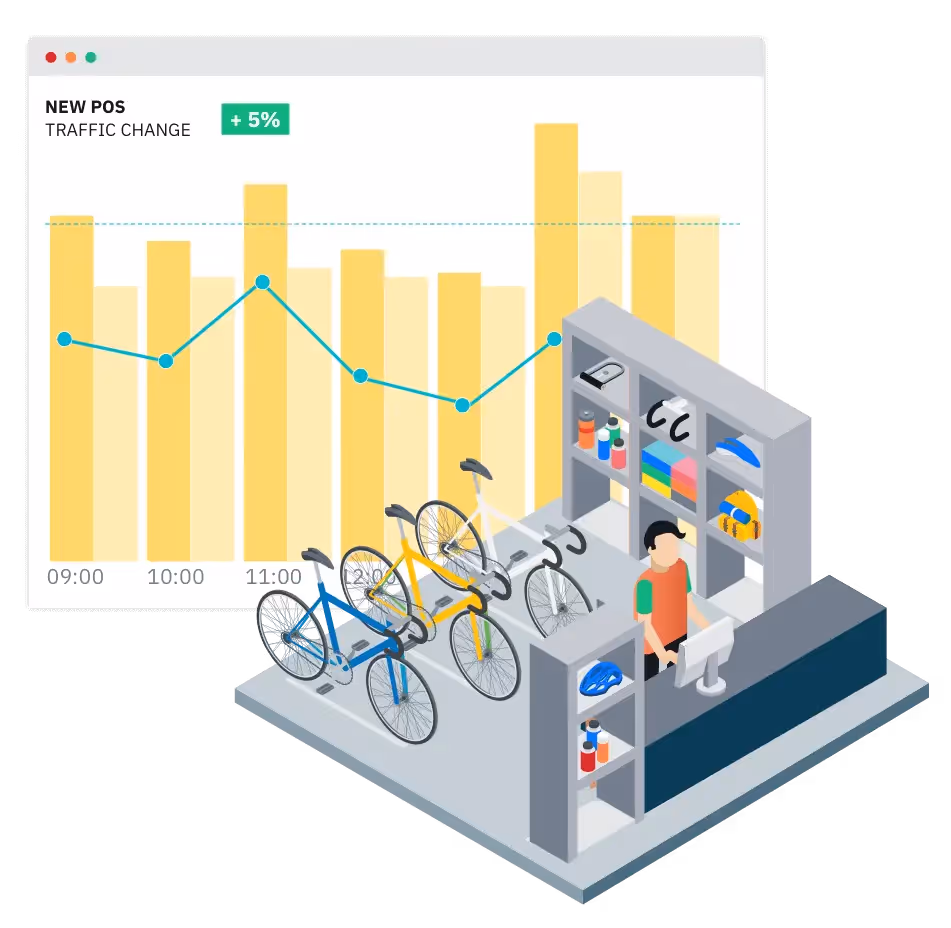
That’s changing. With AI-powered people counters and POS integrations, retailers can now track in-store KPIs with the same precision as their e-commerce dashboards. The result: data-driven decisions on staffing, marketing, merchandising, and store layout that directly improve revenue.
Below, we define the 6 essential retail KPIs, explain how each is calculated, and show how to use them in practice. Whether you run a single store or a multi-location estate, these are the key performance indicators that matter most.
1. Sales Per Square Foot
Formula: Total store sales / square feet of retail space
This should exclude revenue related to click-and-collect or internet returns.
Sales per square foot is a key performance indicator for store size efficiency. It should not be used in isolation — lower than expected sales in a large space could be because of low traffic, or high traffic with constrained sales staff. But in comparing across multiple outlets, this KPI helps plan future growth and rental negotiations with landlords.
2. Sales Per Employee
Formula: Total store sales / average number of floor staff
As with most key performance indicators — but particularly this one — it’s important not to use it in isolation. Keep in mind the objective of your analysis and use the right dataset and time period to inform it.
For example, the question may be whether there are enough sales staff on Saturdays. Over a number of Saturdays, more sales staff could be employed over a sample of the weekends to observe if there is an impact on sales per employee.
This KPI is far more powerful when combined with footfall data, to normalise for store traffic that day — for example, to consider whether the conversion rate was different with more or fewer sales staff.
3. Average Basket Size
This is a critical retail KPI that should come straight out of your POS system: the average number of items bought in each transaction.
Tracking basket size over time reveals the impact of merchandising changes, cross-selling strategies, and promotional campaigns. Combined with footfall data, it shows whether you’re converting more visitors or simply getting bigger orders from the same customers.
4. In-Store Footfall
Another critical key performance indicator — this represents the number of people that walk into your store. On its own, footfall is useful, but the real power comes when combining it with other data over the same time period, such as conversion rates, capture rates and marketing efficiency metrics.
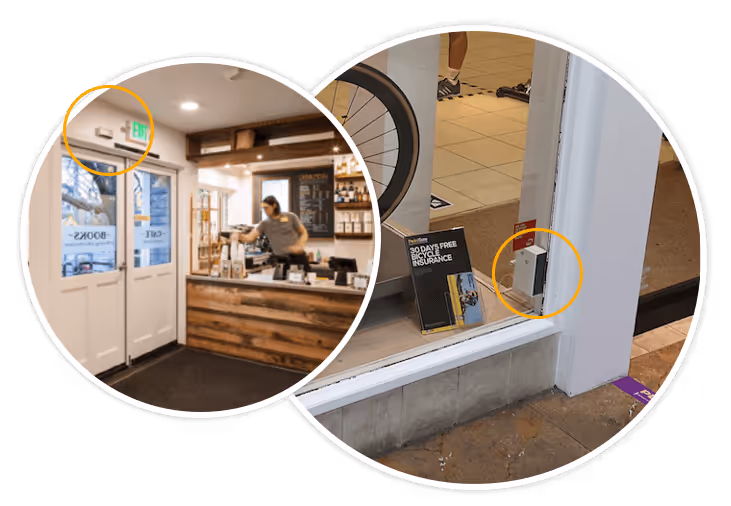
Accurate footfall counting requires an AI-powered people counter sensor mounted above your entrance. Legacy infrared counters achieve only 70-80% accuracy, which makes KPI calculations unreliable. Modern AI counters like Hoxton Convert achieve 98%+ accuracy, giving you data you can trust.
For a deeper dive, read our dedicated article: An Introduction to People Counting in Retail.
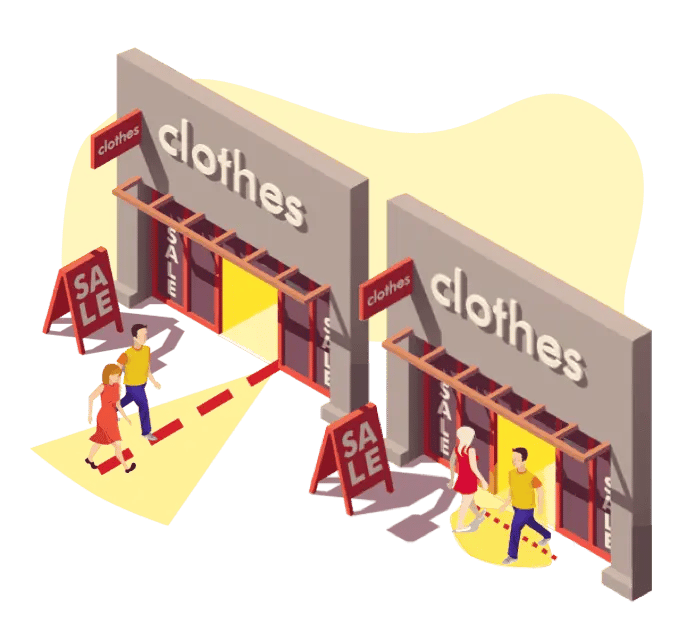
5. Capture Rate (Street-to-Store Footfall)
A key performance indicator that is often overlooked — this quantifies the number of people who walk past your store compared to those who enter.
Formula: (Store entries / passers-by) × 100
This KPI is useful for two things. First, normalising your store footfall and sales against an external variable. Second, understanding the impact of your window displays and advertising.
For many retailers, there can be large changes in sales or footfall due to something entirely external, such as unusual weather or a popular street event. Having metrics on street traffic helps normalise in-store performance — a 40% drop in sales, for example, can be explained by a 40% drop in passing traffic during a rainy day.
For more on this topic, read: How to Use Footfall Analytics to Improve Store Performance.
6. In-Store Conversion Rate
This is arguably the most important key performance indicator for retail: how many people actually buy something in the store.
Conversion Rate = (Buyers / Visitors) × 100
To calculate this accurately, you need two data sources: reliable footfall data from a people counter, and transaction data from your POS system. Platforms like Hoxton Convert combine both automatically, giving you real-time conversion rates by hour, day, and store.
This KPI is most powerful when comparing across stores and understanding the differences. Perhaps an excellent store team is converting at a high rate, or a well-pitched window display is bringing in the right customers. When these differences are understood, the learnings can inform strategy across all stores — potentially driving significant upside in performance.
Read our complete guide: Retail Conversion Rate: The Complete Guide.

How to Start Tracking These KPIs
The biggest barrier to tracking retail KPIs is accurate footfall data. Without it, conversion rate, capture rate, and sales-per-visitor calculations are meaningless. Here’s a practical starting point:
- Install a people counter — an AI sensor above each entrance gives you 98%+ accurate footfall data. See our sensors.
- Connect your POS — platforms like Hoxton Convert for Shopify sync footfall with transaction data automatically.
- Review weekly — set up a weekly dashboard review covering all 6 KPIs. Look for trends, not single data points.
- Benchmark across stores — the real value emerges when you compare locations and understand why they differ.
Summary
These 6 key performance indicators give retailers a complete picture of physical store performance. No single KPI tells the whole story — the power is in combining them to understand whether you have a traffic problem, a conversion problem, a staffing problem, or a merchandising opportunity.
Harnessed correctly, continuous and high-quality KPI data can transform business performance — identifying problems early, setting blueprints for best practices, and leveraging the work of your best store teams across your entire estate.
Frequently Asked Questions
What are the most important KPIs for retail stores?
The six most important key performance indicators for retail stores are: sales per square foot, sales per employee, average basket size, in-store footfall, capture rate (street-to-store), and in-store conversion rate. Together, these KPIs give a complete picture of store efficiency, staff performance, and customer behaviour.
How do you calculate in-store conversion rate?
In-store conversion rate is calculated as (number of buyers / number of visitors) × 100. You need accurate footfall data from a people counter and transaction data from your POS system. AI-powered counters like Hoxton Convert achieve 98%+ accuracy, which is essential for reliable conversion rate calculations.
Why is footfall data important for retail KPIs?
Footfall data is the foundation of most meaningful retail KPIs. Without knowing how many people enter your store, you cannot calculate conversion rate, sales per visitor, or capture rate. It also provides the context needed to interpret other metrics — for example, whether a drop in sales is caused by fewer visitors or lower conversion.
How often should retailers review their KPIs?
Most retailers benefit from weekly KPI reviews, with monthly deep-dives for trend analysis and store-to-store comparison. Real-time dashboards allow managers to respond to daily patterns, while longer-term analysis reveals the impact of marketing campaigns, seasonal changes, and staffing adjustments.
What tools do you need to track retail KPIs?
At minimum, you need a POS system (for sales data) and a people counter (for footfall data). Platforms like Hoxton Convert combine both into a single dashboard with automatic conversion rate calculations, hourly breakdowns, and multi-store benchmarking. Integration with Shopify, Square, and other POS systems is available out of the box.