Setup and Reporting
Experience seamless management of your HoxtonAi devices and access to your data with our intuitive Control Room. From user roles to real-time monitoring, everything you need is at your fingertips.
Control
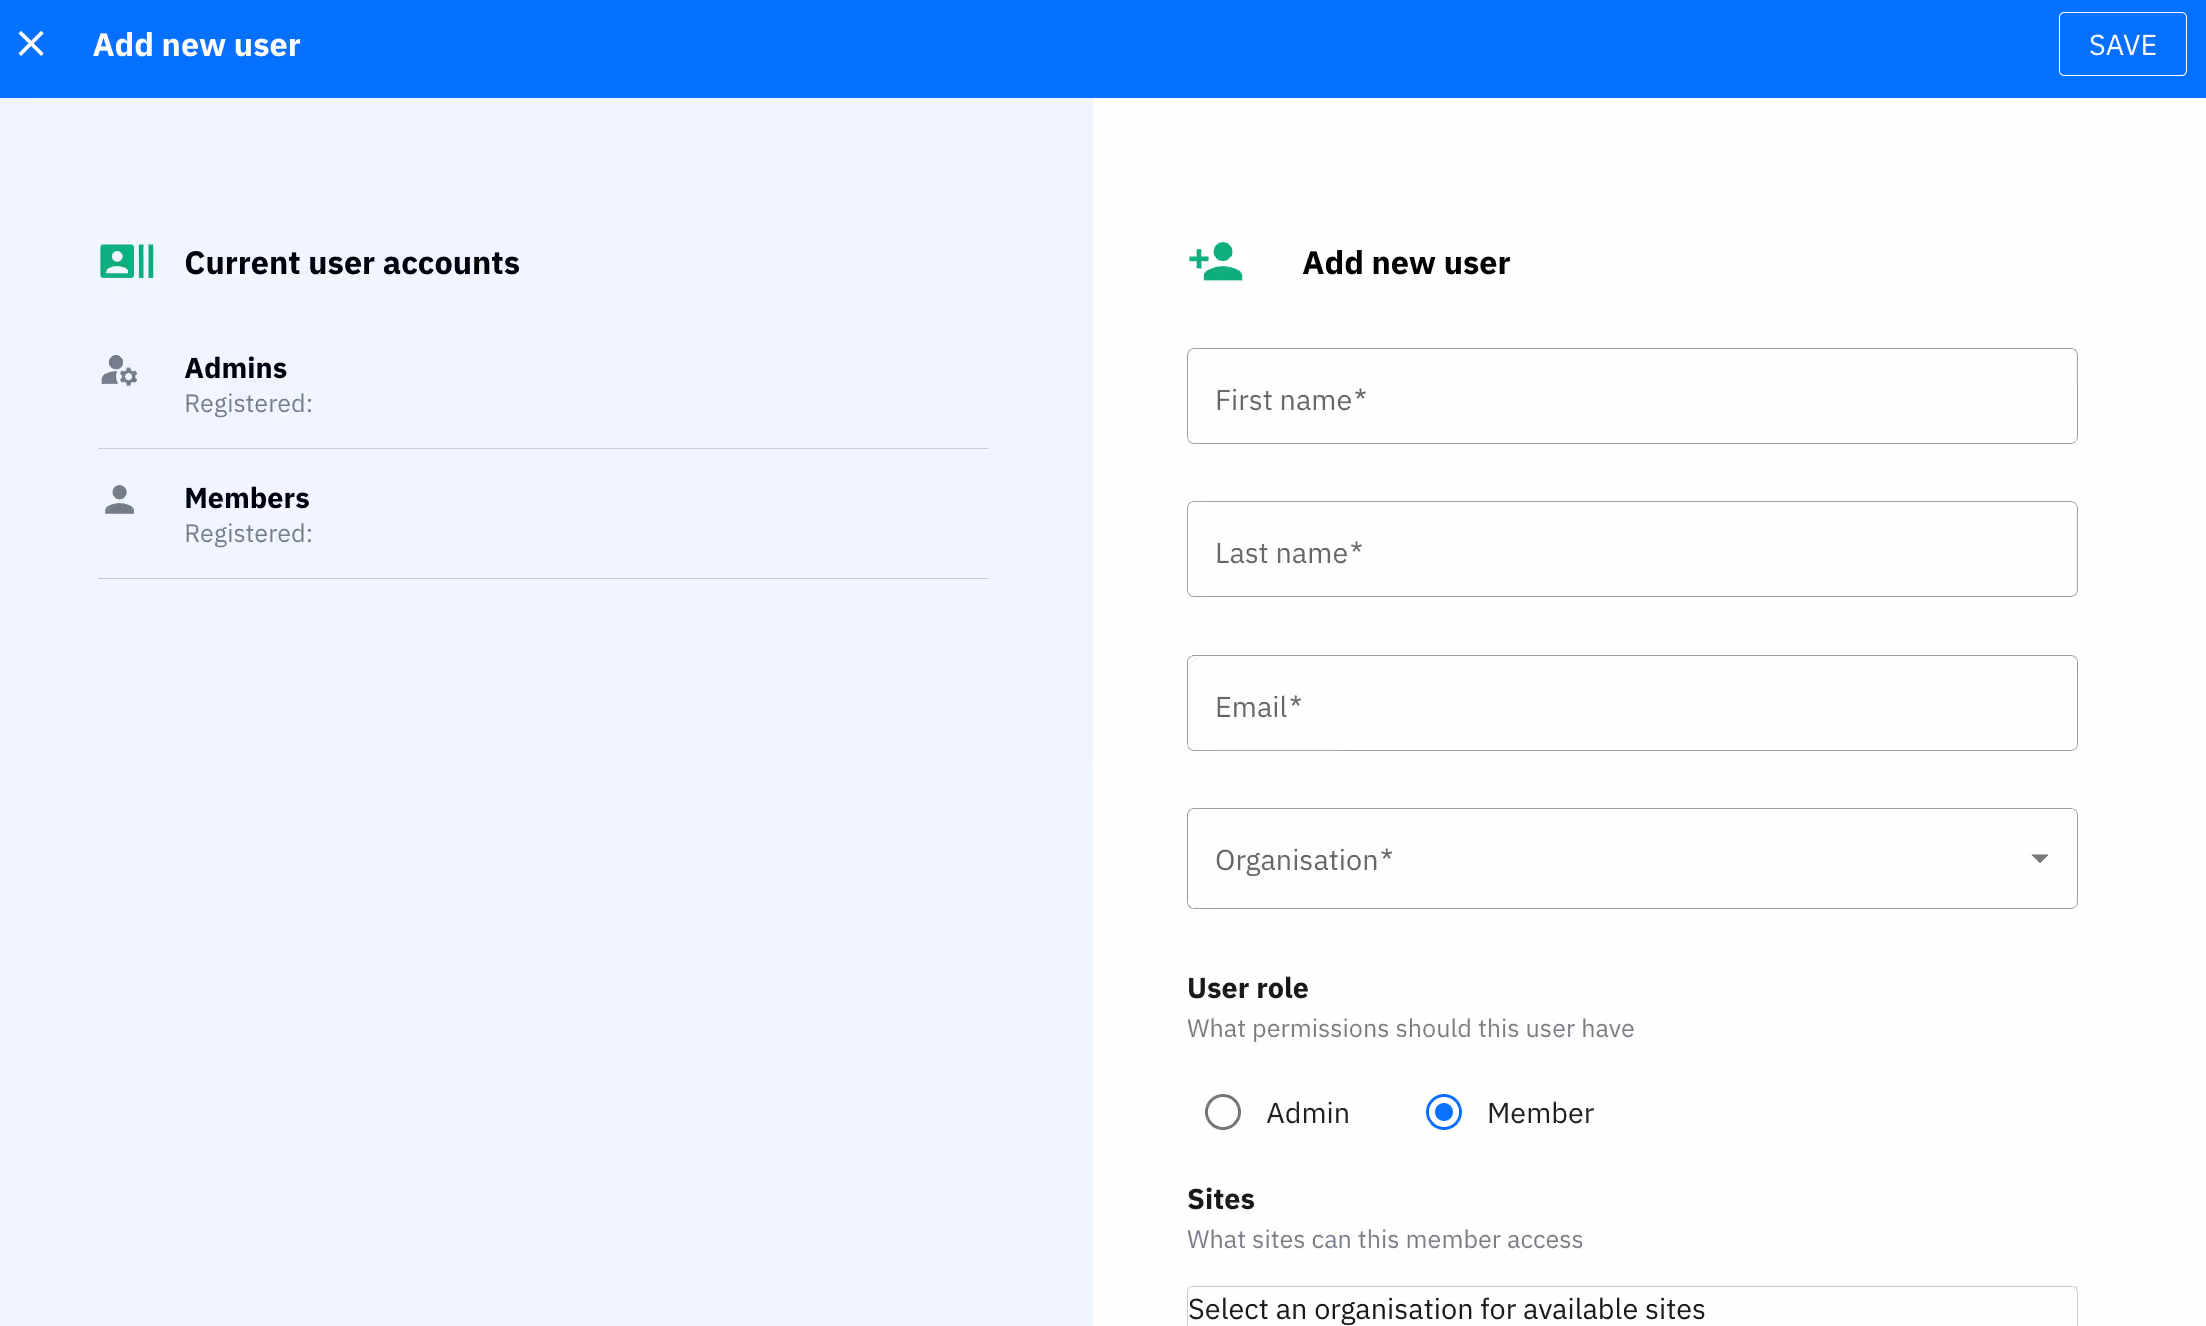
Empower Your Team with Role-Based Access
The Control Room offers distinct user and admin roles, ensuring secure and efficient management of data access. Tailor permissions to fit your team's needs, whether they need a global or local perspective.
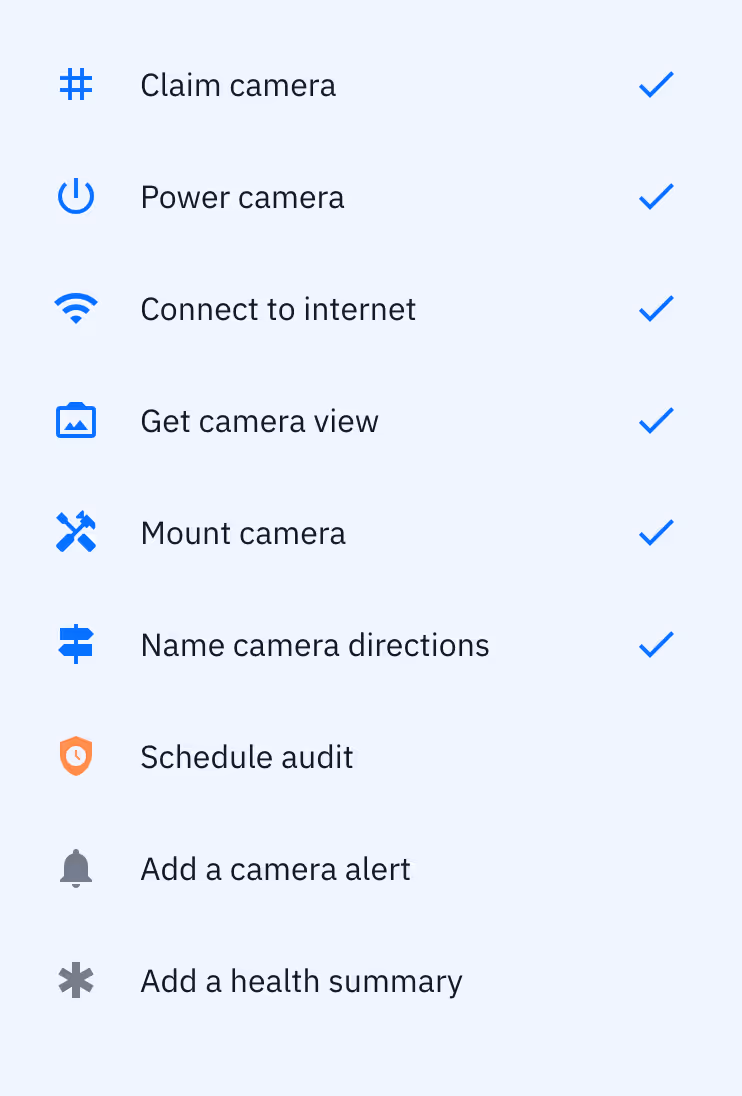
Streamline Device Onboarding with Our Easy Setup Wizard
Our Setup Wizard guides you through sensor deployment to make setup a breeze. With step-by-step guidance, you can get your devices up and running in a matter of minutes.
Quick Start
Easily onboard devices with our intuitive, user-friendly setup process. Once setup we remotely check the deployment for you, to ensure accuracy.
Map out your space
A doorway could be an entrance to one space and an exit of another. Our many-to-many model can take into account the most complex sitemaps.
Comprehensive Monitoring and Health Checks for Your Devices
Real-Time Device Status
Our platform provides seamless online and offline monitoring to ensure your devices are online and optimal.
Installation audit
As part of the setup procedure, we provide an accuracy audit to ensure the best data quality.
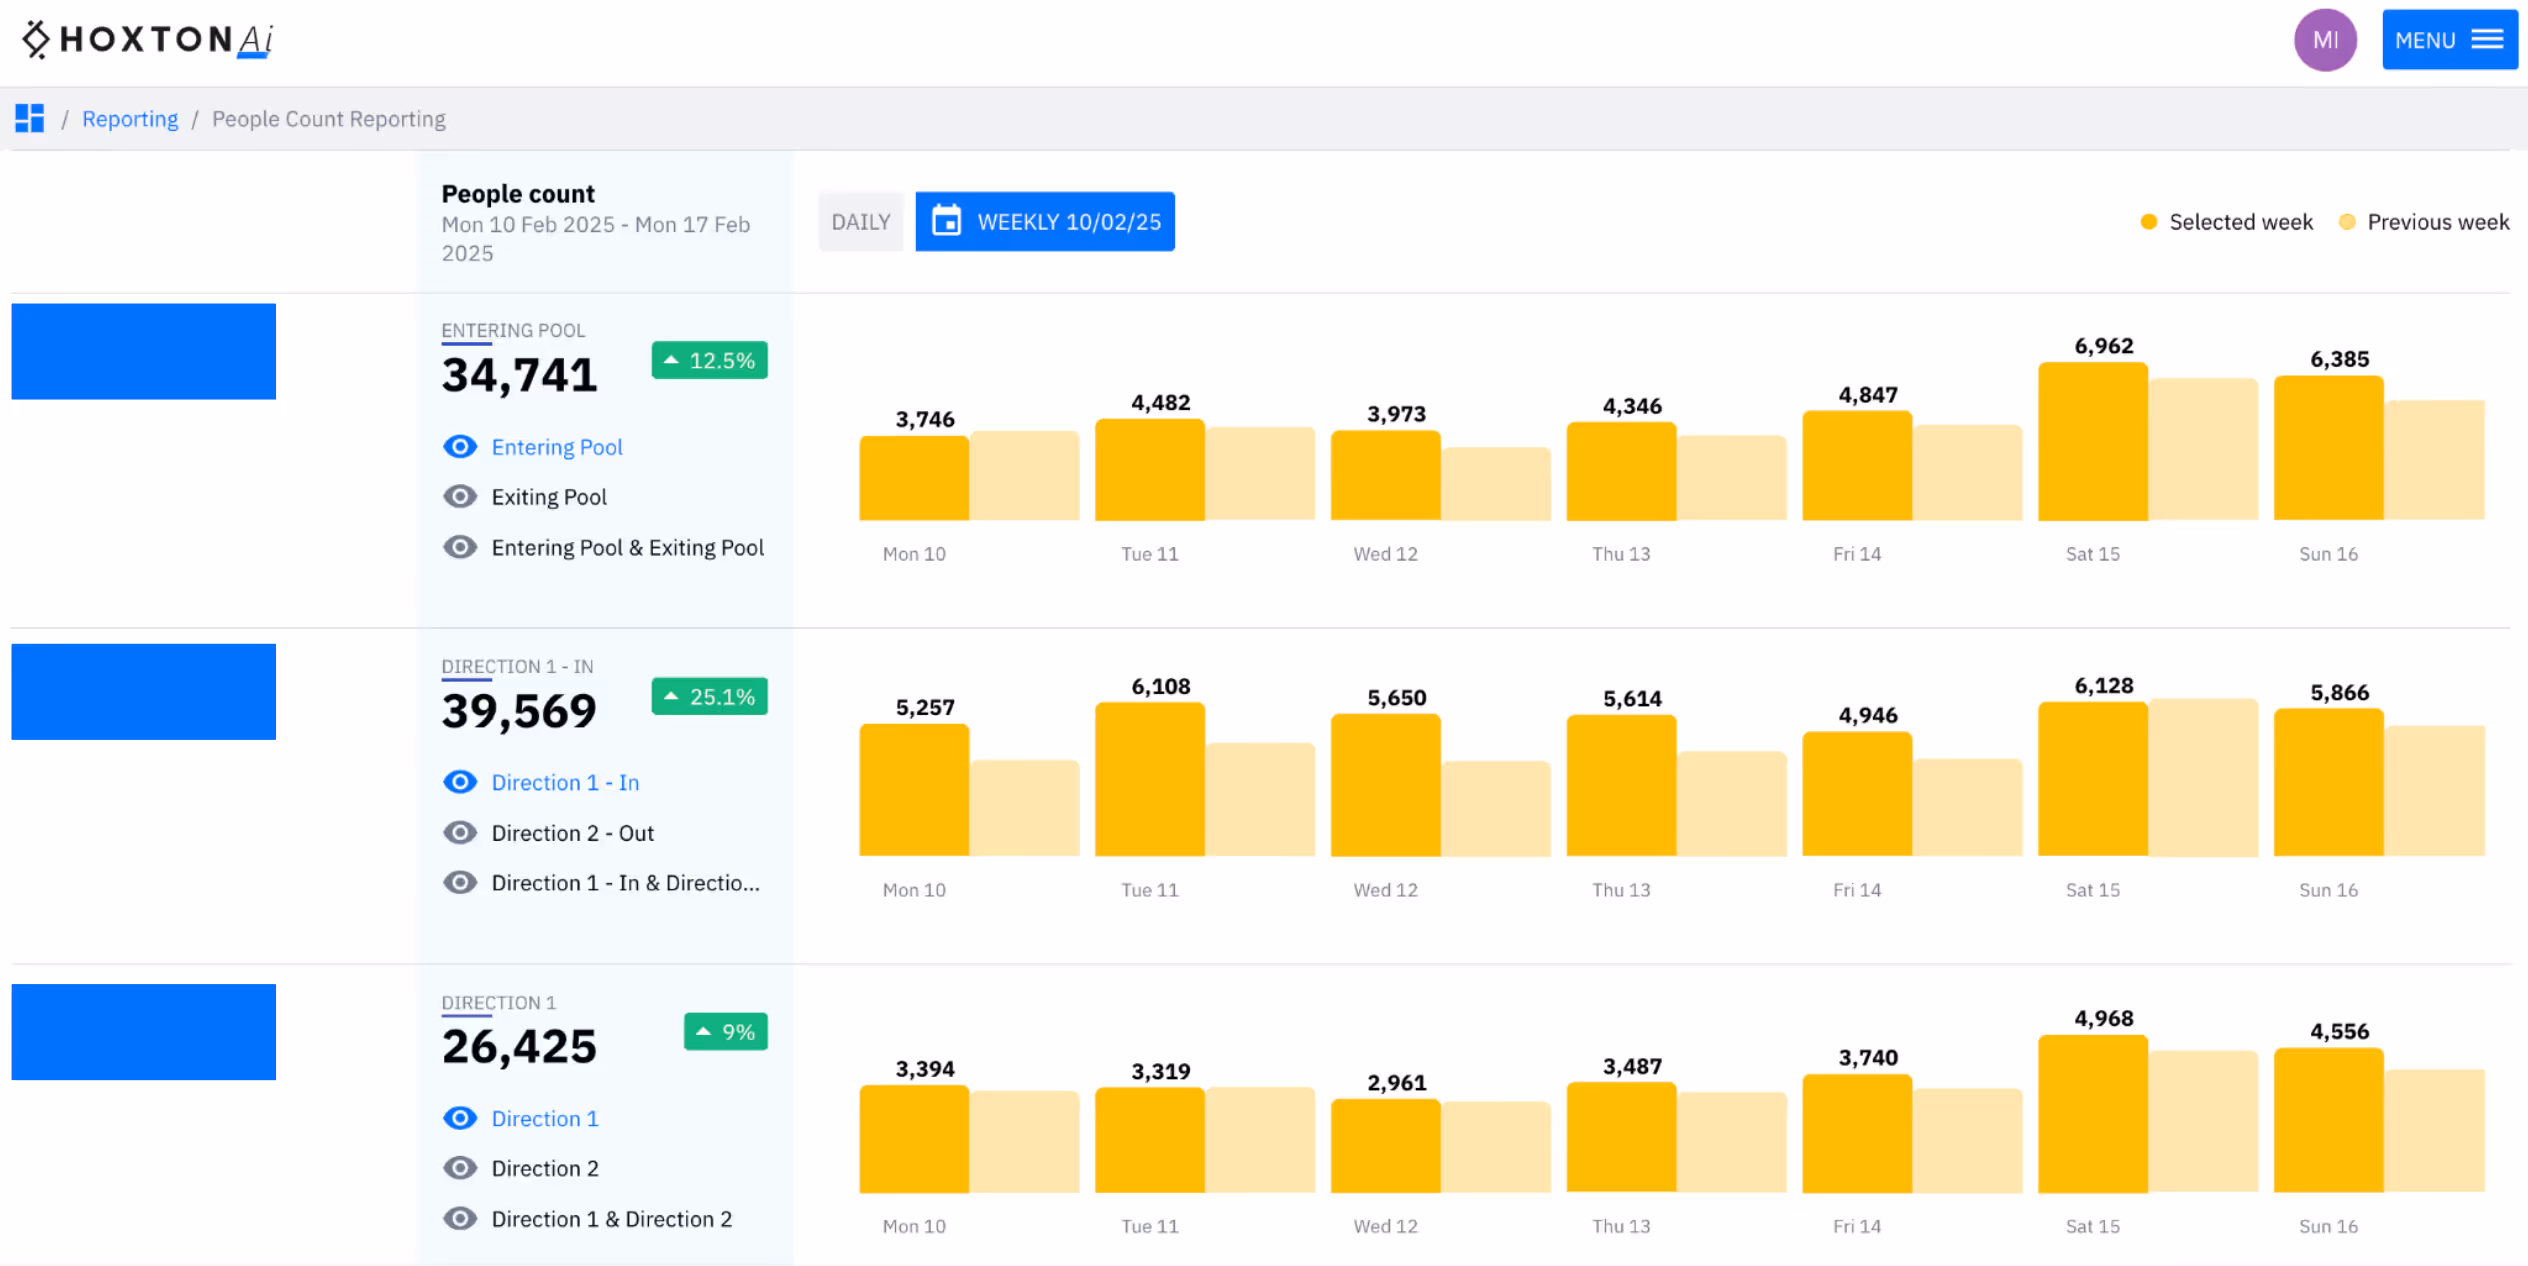
The visualisations you need
Our intuitive charts, graphs and tables are designed for your specific needs and use cases.
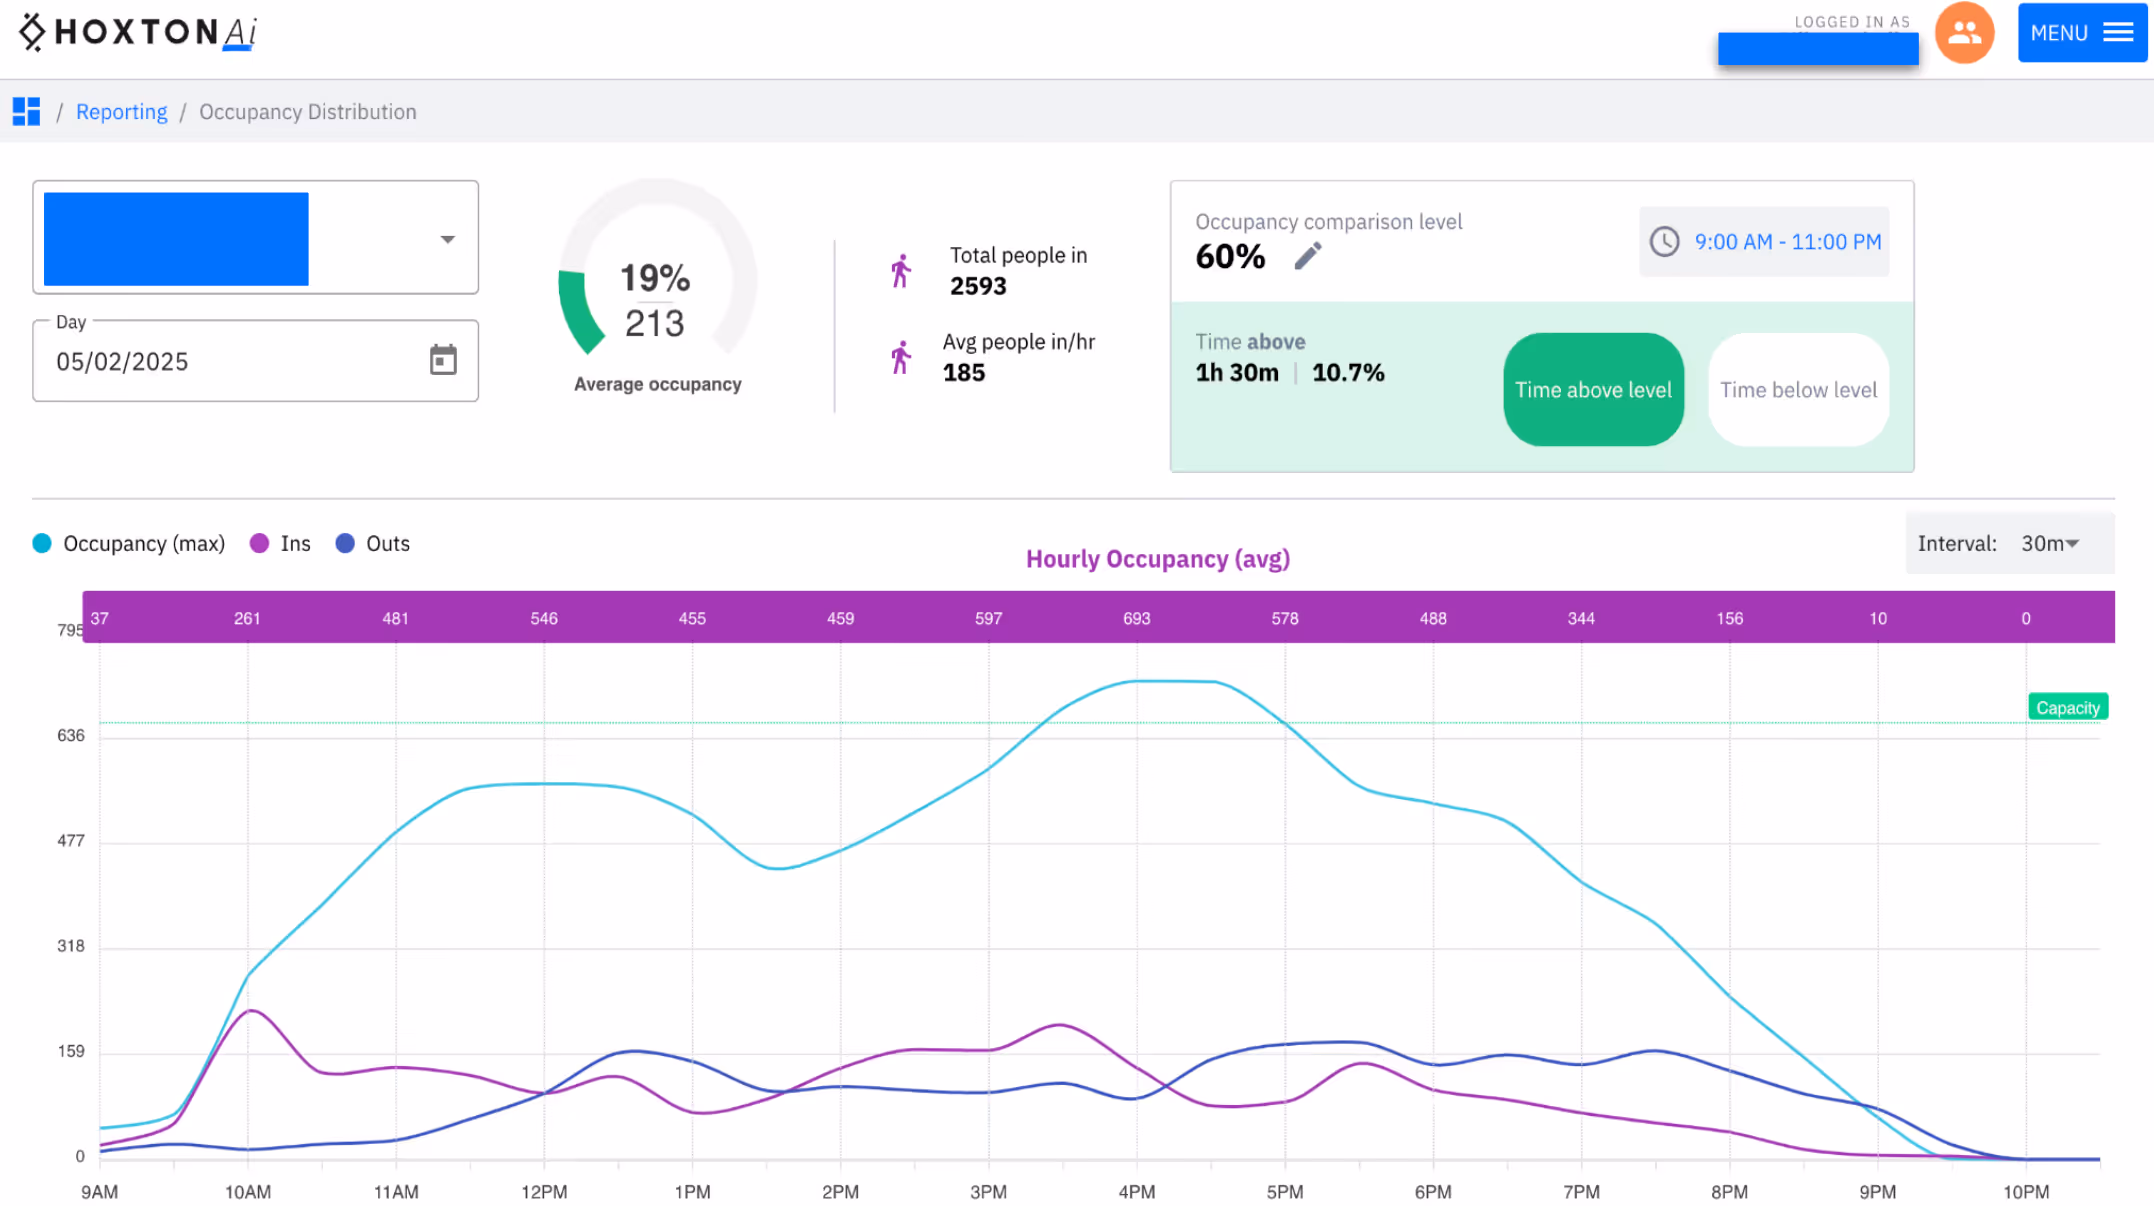
Visualise Your Data with Dynamic Charts and Graphs in Control Room
At-a-glance live data, or annual trends. Easily browse and download the reports and insights to keep your team informed and agile. With our user-friendly interface, you can quickly access and share the data you need.
FAQs
Explore our frequently asked questions to better understand the HoxtonAi cloud platform features.