Once we saw the graph, we realised we were able to admit 50% more visitors in the first time slot to get capacity up quickly. We also added 20% more tickets to the other time slots.
Located in Cardiff Bay, Techniquest is an interactive science centre set over two floors. Head of Commercial Development, Gareth McTiffin explains what led them to gather occupancy data and how they're now using it for commercial advantage.
In early 2020, the Techniquest team were gearing up to launch an extension to the building when the venue was closed to go into lockdown. The extension doubled the floor space, creating space for more digital exhibits and therefore more visitors.
As part of the extension work, a new ticketing system was installed to help reimagine how guests were admitted over the course of a day. Previously, visitors were admitted until it felt too busy, at which point the front desk would move to a one in, one out scenario that left people queuing to get in. The new time-slotted ticketing system was expected to help structure the flow of guests throughout the day.
When Techniquest reopened their doors after lockdown, Gareth was focused on keeping visitors safe by controlling numbers on the exhibition floor. In addition to timed ticketing, cleaning was scheduled in between the slots and a number of exhibits were shut as they required close interaction from visitors. Ticket intervals were also kept longer to ensure everyone had a great experience.
It’s an ongoing balance between how many tickets we’re able to sell, [visitor] engagement on the floor, and keeping an eye on the NPS score.
In theory, Gareth knew how many people should be on site at any one time since the timed slots were three hours long, and each slot had an allocated number of tickets. The reality was quite different, and highlighted the fact that there was an opportunity to add more tickets to the time slots. Unfortunately, without accurately knowing how many people were on the floor at any one time, it was difficult for Gareth to see how to do this whilst maintaining a positive visitor experience.
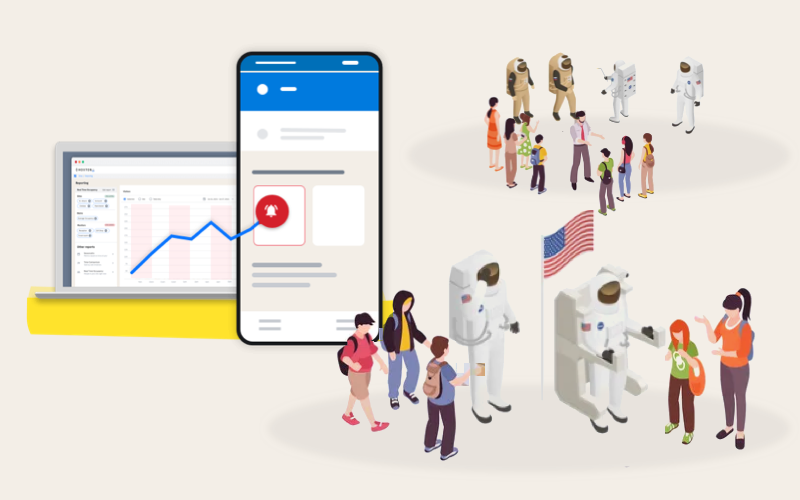
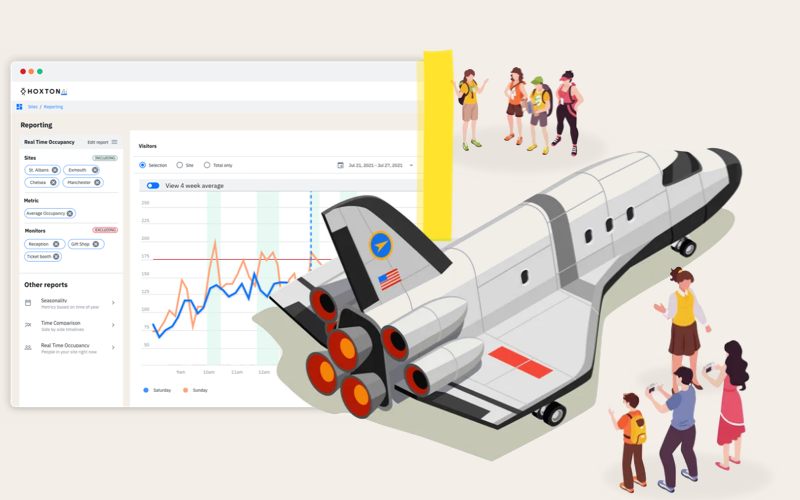
Gareth decided to install the HoxtonAi solution to monitor the occupancy of their space - here’s what they found:
- The space doesn’t fill up to maximum capacity immediately when they open, despite being sold out.
- It takes about two hours to get up to maximum capacity.
- There is a variation in the visitor time of stay across the day.
- After midday, the maximum capacity stays fairly constant across the day.
- Visitors arrived early in the hour for certain slots (10am,12 & 3pm) and more spread out for others (11am, 1pm, 2pm).
- There were high exit numbers between 1 and 2pm which caused a low point in occupancy around 2pm.
In addition to monitoring occupancy, Gareth also monitors the Net Promoter Score (NPS) using a post-visit survey. He knows the longer guests have to wait to see an exhibit, the more the NPS will dip.
Based on what was highlighted by the occupancy data, Gareth has increased the number of tickets sold in their first slot by 50%. The number of tickets sold in the other time slots has also gone up by 20%, with Gareth keeping a close eye on the NPS. He aims to increase admissions further by the end of the year.
To counter the slope towards the end of the day, Gareth has introduced a discounted 3pm rate. In doing so, more people are encouraged to visit which keeps occupancy levels high.
Having access to data that we never had before, and being able to make decisions based on that data is reassuring to everyone in our organisation.