Footfall KPIs Every Retail Manager Should Track
Introduction
You're tracking revenue. But are you tracking the metrics that actually drive it?
Revenue is a lagging indicator—it tells you what happened yesterday. Leading indicators like footfall, conversion rate, and dwell time tell you what's about to happen.
Smart retail managers don't just count revenue. They monitor a comprehensive set of KPIs (Key Performance Indicators) that reveal how the store is performing operationally. These metrics identify problems before they impact the bottom line, reveal which improvements actually work, and guide daily decisions about staffing, layout, and marketing.
In this guide, we'll explore 10 essential footfall-related KPIs that every retail manager should track, what they mean, industry benchmarks, and how to act on them.
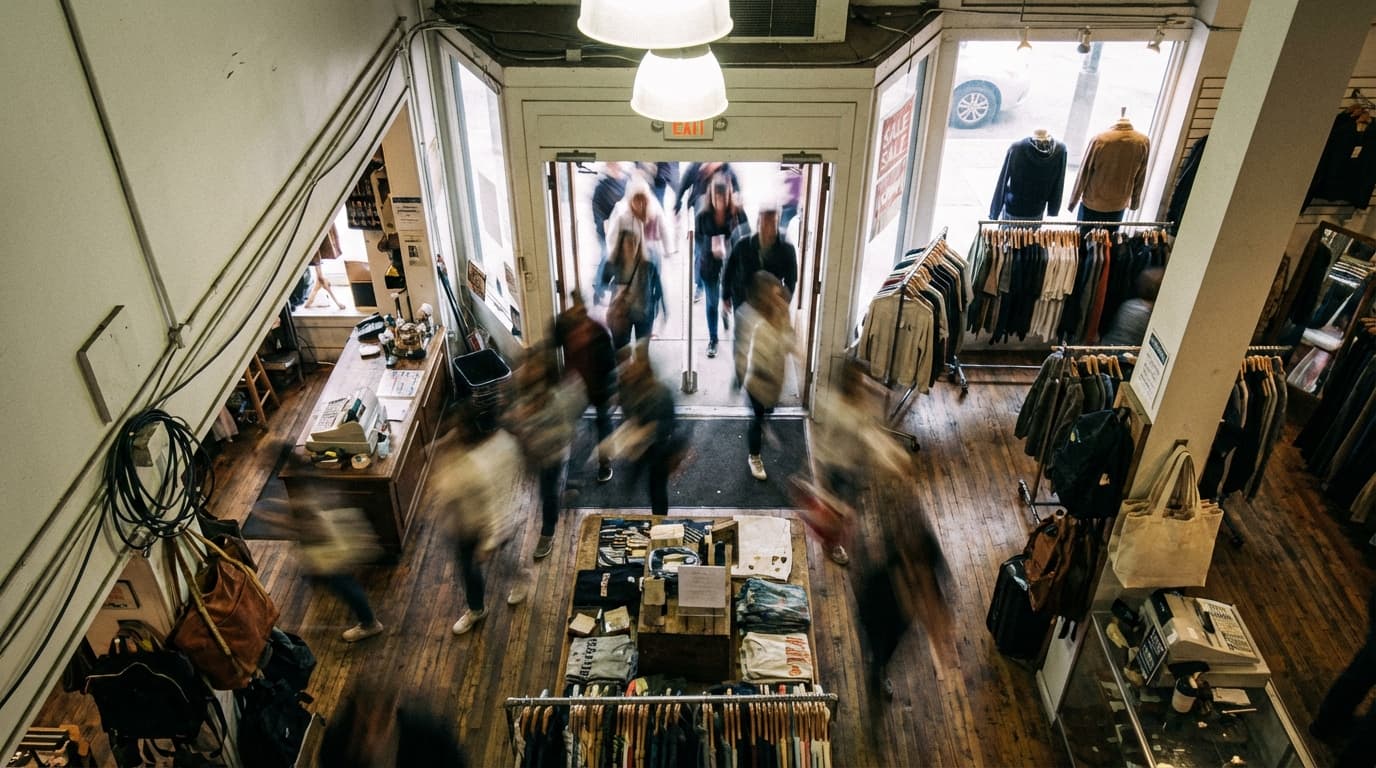
1. Total Footfall (Daily, Weekly, Monthly Visitors)
Definition
The absolute number of people entering your store in a given period.
Formula
Total Footfall = Sum of all visitors in period
Example: 4,200 visitors over a 7-day week
Industry Benchmarks
| Store Type | Daily Visitors | Weekly Visitors | Notes |
|---|---|---|---|
| Small Boutique | 80-150 | 560-1,050 | Single location, niche products |
| Mid-Size Retail | 200-500 | 1,400-3,500 | Multi-category, 3,000-5,000 sq ft |
| Large Format | 1,000-3,000 | 7,000-21,000 | Supermarket, department store |
| Shopping Center | 5,000-15,000 | 35,000-105,000 | Multi-tenant, high footfall |
| Airport/Station | 10,000-50,000 | 70,000-350,000 | High-volume transit hub |
Why It Matters
Total footfall is the ceiling on revenue. No footfall = no sales, regardless of conversion efficiency. Tracking trends reveals:
- Is marketing bringing in more visitors?
- Are seasonality changes expected?
- Is local foot traffic declining (competitor threat)?
- How does this location perform vs. other stores?
How to Improve It
- Marketing campaigns: Track footfall before, during, and after promotional campaigns
- Seasonal events: Tie promotions to holidays, local events, or back-to-school
- Store visibility: Window displays, signage, and façade cleanliness attract browsers
- Extended hours: Some locations see uplift from opening earlier or staying open later
- Co-marketing: Partner with adjacent retailers or brands to co-promote
- Online integration: Drive online visitors to physical stores (offer exclusive in-store promotions)
Red Flags
- Footfall declining week-over-week without known reason (lost foot traffic source)
- Footfall declining year-over-year despite increased marketing spend (marketing ineffective or environment changing)
- Significant gap between peak and off-peak (understaffed during busy times, overstaffed during slow periods)
2. Conversion Rate
Definition
The percentage of store visitors who complete a purchase.
Formula
Conversion Rate (%) = (Total Transactions ÷ Total Visitors) × 100
Example: 4,200 visitors, 630 transactions = 15% conversion rate
Industry Benchmarks
| Sector | Benchmark Range |
|---|---|
| Fashion & Apparel | 20-25% |
| Grocery & Supermarket | 40-50% |
| Electronics | 10-15% |
| Luxury & Jewelry | 15-20% |
| Beauty & Cosmetics | 25-35% |
| Furniture & Home | 8-12% |
| Sports & Outdoor | 18-25% |
| Pharmacy | 35-50% |
| Bookstore | 20-28% |
Why It Matters
Conversion rate reveals operational efficiency. A high-traffic store with low conversion suggests problems:
- Understaffed (long waits deter buyers)
- Poor layout (customers can't find products)
- Weak merchandising (products not visibly appealing)
- Pricing issues (not competitive)
- Inventory problems (out of stock on key items)
Improving conversion by 1-2% annually is realistic and transformative.
How to Improve It
- Staff training: Teach floor team to engage customers and guide to purchase
- Optimize layout: Place bestsellers at eye level, create logical flow
- Better merchandising: Visual displays stop browsers and convert to buyers
- Reduce friction: Quick checkout, multiple payment options, minimal wait times
- Product info: Clear pricing and sizing information removes hesitation
- Inventory: Stock bestsellers heavily; reduce slow-moving inventory
Red Flags
- Conversion declining while footfall stable (operational problem, not traffic issue)
- Conversion flat despite increased staffing (training or layout issue)
- Significant variation day-to-day (quality of staff or operations inconsistent)
- Conversion worse than sector benchmark (major problem)
3. Average Transaction Value (ATV)
Definition
Average revenue per purchase made.
Formula
Average Transaction Value = Total Revenue ÷ Total Transactions
Example: £42,000 revenue ÷ 630 transactions = £66.67 ATV
Industry Benchmarks
| Sector | ATV Range |
|---|---|
| Fast Fashion | £30-£60 |
| Department Stores | £60-£150 |
| Luxury Fashion | £200-£500+ |
| Supermarket | £35-£75 |
| Electronics | £150-£400 |
| Bookstore | £15-£35 |
| Pharmacy | £20-£40 |
| Furniture | £400-£2,000+ |
Why It Matters
ATV reveals whether customers are buying single items (impulse) or multiple items (planned purchase). Rising ATV means:
- Customers are buying more per visit
- Effective upselling or cross-selling
- Better inventory of higher-margin products
Falling ATV suggests:
- Shift toward discount/bargain hunting
- Loss of higher-margin product customers
- Ineffective merchandising or upselling
How to Improve It
- Bundle offerings: "Buy shoes and get discounted socks"
- Upsell training: Teach staff to suggest complementary products
- Strategic placement: Place high-margin items near checkout
- Product ranges: Ensure breadth of price points (some £30 items, some £150 items)
- Promotions: Spend thresholds ("Spend £50 and get 20% off") drive larger baskets
Red Flags
- ATV declining despite stable/rising footfall (customers buying less)
- ATV significantly below sector average (pricing or mix issue)
- ATV extremely variable (inconsistent sales process or staffing)
4. Sales Per Visitor
Definition
Total revenue divided by total visitors. Combines conversion rate and ATV into one metric.
Formula
Sales Per Visitor = Total Revenue ÷ Total Visitors
Example: £42,000 revenue ÷ 4,200 visitors = £10 per visitor
Industry Benchmarks
| Sector | Sales Per Visitor |
|---|---|
| Fashion | £8-£15 |
| Supermarket | £14-£35 |
| Electronics | £15-£60 |
| Luxury | £30-£150+ |
| Beauty | £10-£20 |
Why It Matters
Sales per visitor is the most holistic metric. It captures everything: traffic attraction, conversion, and transaction size. Rising sales per visitor (with stable or rising footfall) indicates genuine operational improvement.
How to Improve It
Improve this by targeting either conversion rate or ATV (or both):
- Increase footfall by 10%, conversion stays same = +10% revenue (if cost stable)
- Keep footfall same, increase ATV 10% = +10% revenue (easier path often)
- Increase conversion 1 percentage point, stable footfall/ATV = +1-2% revenue
Red Flags
- Declining sales per visitor despite rising footfall (traffic growth hiding conversion/ATV problems)
- Sales per visitor significantly below comparable stores (operational problems)
5. Peak Hour Traffic (and Off-Peak Traffic)
Definition
Footfall during the busiest hours vs. slowest hours. Identifies peak periods and capacity constraints.
Formula
Peak Hour Traffic = Total visitors during peak hours ÷ Total daily visitors
Example: Daily footfall 400 visitors. Peak hours (lunch 12-1pm, 5-7pm) = 160 visitors (40% of daily traffic)
Industry Benchmarks
Peak hour concentration varies by sector:
| Sector | Peak Hour % of Daily Traffic |
|---|---|
| Retail (general) | 25-35% |
| Lunch-focused (food) | 40-50% |
| Evening shopping | 35-45% |
| Weekend retail | 40-50% |
Why It Matters
Peak hour data enables:
- Staffing optimization: Place experienced staff during peaks, reduce cost during off-peak
- Capacity planning: Ensure checkouts, fitting rooms, staff can handle peak volume
- Service quality: Prevent long queues that kill conversion during busy times
- Inventory placement: Ensure bestsellers are stocked and visible during peaks
How to Improve It
- Track patterns: Identify consistent peak times (lunch? evening? weekends?)
- Adjust staffing: If peak is 12-2pm, schedule staff to arrive by 11:45am
- Train for peaks: Your best staff during peaks
- Queue management: Ensure second checkout can open if queues form
- Event marketing: Drive traffic to off-peak times with targeted promotions
Red Flags
- Extreme peaks (80%+ of traffic in 2-4 hours) indicate staffing imbalance
- Unable to serve customers during peaks (conversion drops during busy times)
- No clear peak pattern (suggests traffic is random or location needs repositioning)
6. Dwell Time
Definition
Average time a customer spends in the store.
Formula
Dwell Time = (Total time all customers spent in store) ÷ (Total customers)
Example: Total dwell 600 minutes ÷ 200 customers = 3 minutes average
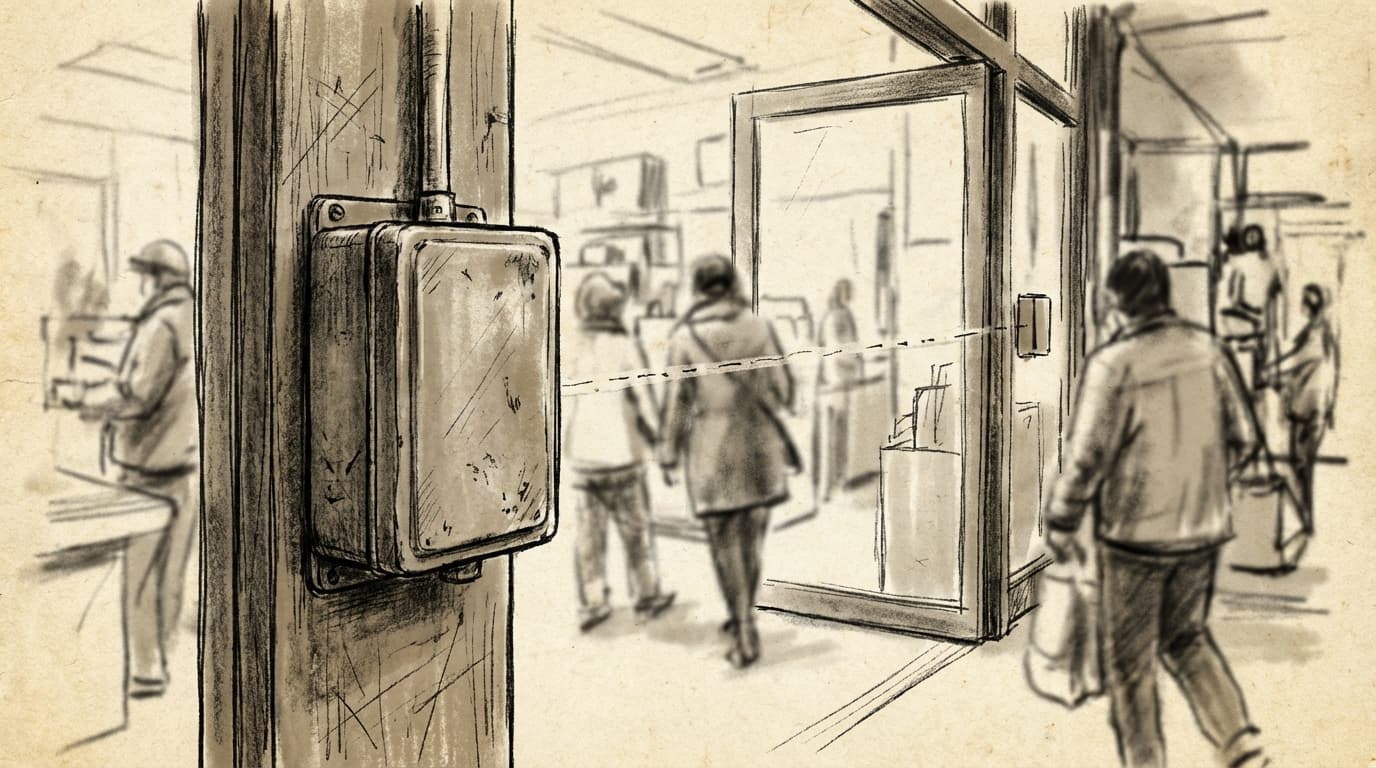
Note: Advanced footfall systems (AI cameras, thermal imaging) can measure this; simple infrared beams cannot.
Industry Benchmarks
| Sector | Typical Dwell Time |
|---|---|
| Convenience Store | 2-4 minutes |
| Fast Fashion | 5-10 minutes |
| Supermarket | 15-25 minutes |
| Luxury Fashion | 10-20 minutes |
| Department Store | 20-40 minutes |
| Bookstore | 15-30 minutes |
Why It Matters
Dwell time reveals engagement:
- High dwell, high conversion: Customers are seriously shopping
- High dwell, low conversion: Customers interested but not purchasing (pricing? size? style issue?)
- Low dwell, high conversion: Efficient shoppers (good for supermarkets)
- Low dwell, low conversion: Quick rejection (layout or merchandising problem)
How to Improve It
- Better merchandising: Attractive displays encourage browsing
- Comfortable environment: Sitting areas, good lighting, climate control
- Clear signage: Help customers find what they want
- Product discovery: Encourage exploration with "You may like..." displays
- Music & ambiance: Create an environment where people want to spend time
Red Flags
- Dwell time declining while conversion flat (customers lose interest but still buy—not sustainable)
- Dwell time very low (customers reject store quickly; major problem)
- High variation in dwell time (inconsistent experience)
7. Bounce Rate (Walk-Bys vs. Entrants)
Definition
The percentage of people passing your store who actually enter (and those who don't).
Formula
Bounce Rate (%) = (People who pass but don't enter ÷ Total people passing store) × 100
Example: 5,000 people pass store entrance, 3,000 enter = 40% bounce rate (60% entrants)
Note: Requires footfall system that counts both passers and entrants.
Industry Benchmarks
| Location | Typical Bounce Rate |
|---|---|
| Shopping Center (destination) | 20-30% |
| Street Retail (high traffic) | 40-60% |
| Secondary location | 60-75% |
Why It Matters
Bounce rate reveals attraction strength. If 70% of people passing your store don't enter, you have a visibility or appeal problem:
- Poor window display: Doesn't attract attention
- Wrong location: Foot traffic passing isn't your target customer
- Signage/branding: Not clear what's inside
- Appearance: Dirty window, outdated storefront deters entry
How to Improve It
- Window displays: Change weekly to attract attention
- Signage: Clear, enticing window signage ("New Arrivals," "Sale")
- Lighting: Bright, inviting window lighting attracts nighttime shoppers
- Cleanliness: Clean windows and entrance are essential
- Enticing offers: Visible promotions or eye-catching products in window
Red Flags
- Bounce rate above 60% (most people passing don't enter)
- Bounce rate increasing (declining appeal)
- Bounce rate same but store revenue declining (fewer people passing the store)
8. Staff-to-Customer Ratio
Definition
Number of customers per staff member on floor during a given period.
Formula
Staff-to-Customer Ratio = Active Customers ÷ Floor Staff
Example: 45 customers in store, 3 floor staff = 1:15 ratio (one staff per 15 customers)
Industry Benchmarks
| Sector | Ideal Ratio |
|---|---|
| Luxury Fashion | 1:8-1:10 (high touch) |
| Department Store | 1:15-1:20 |
| Fast Fashion | 1:20-1:30 |
| Supermarket | 1:40-1:60 (stocking-focused) |
| Electronics | 1:15-1:20 (high touch) |
Why It Matters
Staff-to-customer ratio impacts:
- Conversion: More staff = faster engagement = higher conversion
- Service quality: Long wait times with few staff = poor experience
- Upselling: One-on-one time enables better recommendations
- Labor cost: More staff = higher labor costs
The ideal ratio balances service quality with profitability.
How to Improve It
- Track during peaks: If peak times have 1:40 ratios, you're understaffed
- Adjust scheduling: Add staff during peak hours
- Empower with technology: Self-checkout, digital fitting room info reduces staff dependency
- Cross-train: Stockroom staff help on floor during peaks
Red Flags
- Ratio worse (more customers per staff) than benchmark (service suffering)
- Conversion declining but ratio stable (staffing quality issue, not quantity)
- Ratio improving but conversion declining (wrong staff scheduled, untrained)
9. Marketing Campaign Attribution (Footfall Uplift)
Definition
Increase in footfall driven by a specific marketing campaign.
Formula
Campaign Footfall Uplift (%) = (Footfall during campaign − Baseline footfall) ÷ Baseline footfall × 100
Example:
- Baseline daily footfall: 400 visitors
- During campaign: 520 visitors
- Uplift = (520 − 400) ÷ 400 × 100 = +30% footfall increase
Industry Benchmarks
Expected footfall uplift by campaign type:
| Campaign Type | Expected Uplift |
|---|---|
| Local social media | +10-25% |
| Email to database | +15-30% |
| In-store promotion (signs) | +5-15% |
| Event sponsorship | +20-40% |
| Press/media coverage | +30-50%+ |
| Grand opening/relaunch | +50-100%+ |
Why It Matters
Footfall uplift reveals marketing effectiveness. Many campaigns are forgotten quickly or poorly targeted. Tracking uplift answers:
- Did this campaign actually bring people in?
- What's the customer acquisition cost? (Campaign cost ÷ incremental visitors)
- Did uplift convert to revenue? (Incremental revenue ÷ campaign cost)
- Which campaigns work best for this location?
How to Improve It
- Test promotions: A/B test different campaigns on different weeks
- Time campaigns strategically: Evening social media ads work better for evening shoppers
- Localize messaging: Different neighborhoods respond to different messages
- Measure holistically: Track footfall AND conversion to ensure uplift converts to profit
Red Flags
- Campaign increases footfall but conversion drops (attracting wrong customer)
- Large campaigns with zero footfall impact (poor execution or targeting)
- Footfall uplift but no revenue uplift (not converting properly)
10. Year-Over-Year Growth
Definition
Footfall, conversion, or revenue in current period vs. same period last year.
Formula
YoY Growth (%) = (Current Year Value − Prior Year Value) ÷ Prior Year Value × 100
Example:
- February 2023 footfall: 8,400 visitors
- February 2024 footfall: 9,240 visitors
- YoY growth = (9,240 − 8,400) ÷ 8,400 × 100 = +10% growth
Industry Benchmarks
Expected YoY growth rates vary by maturity:
| Business Stage | YoY Growth Target |
|---|---|
| Early stage (0-2 years) | +20-50% |
| Growth (2-5 years) | +10-25% |
| Mature (5+ years) | +3-10% |
| Market decline | 0% to -5% acceptable |
Why It Matters
YoY comparison controls for seasonality. Comparing February to February removes "why is traffic down" confusion—is it the month or a real decline?
YoY trends reveal:
- Real growth (even if traffic down vs. last month)
- Market maturity (growth slowing = market saturation)
- Competitive pressure (slow or negative growth)
- Expansion success (new store performing vs. mature stores)
How to Improve It
- Marketing expansion: Grow marketing budget if seeing positive ROI
- Location expansion: If store growing steadily, consider second location
- Product innovation: Refresh assortment to attract new customers
- Customer retention: Loyalty programs bring repeat customers
- Operational excellence: Improve conversion, dwell time, service to support growth
Red Flags
- Flat or negative YoY growth (business stalling)
- Growth slowing (maturity setting in)
- Growth inconsistent month-to-month (execution challenges)
Using KPIs Together: The Dashboard Approach
Smart retailers don't obsess over any single KPI. They monitor a dashboard that reveals the whole picture.
Sample Daily Dashboard for Fashion Retailer
| KPI | Target | Actual | Status |
|---|---|---|---|
| Daily Footfall | 400 | 385 | ⚠️ Slightly low |
| Conversion Rate | 22% | 20.8% | ⚠️ Below target |
| ATV | £72 | £70.50 | ✓ On target |
| Sales Per Visitor | £15.85 | £14.70 | ⚠️ Below target |
| Peak Hour Traffic | 35-40% | 42% | ✓ Strong peaks |
| Avg Dwell Time | 8 min | 7.5 min | ✓ Good |
| Staff:Customer Ratio | 1:18 | 1:20 | ⚠️ Slightly understaffed |
Insights: Footfall and conversion both slightly low. Likely issue: understaffing (ratio 1:20 vs. target 1:18). Solution: Add one floor staff during peak hours.
Without the dashboard, management might focus on footfall decline. With it, the real problem (understaffing reducing conversion) becomes clear.
Implementing KPI Tracking
Step 1: Choose Your System
Not all footfall systems capture all KPIs:
- Infrared beams: Total footfall only
- Thermal imaging: Footfall + directional (entry vs. exit)
- WiFi tracking: Footfall + dwell time (limited)
- AI cameras: All KPIs (footfall, dwell, behavioral patterns)
Step 2: Set Baselines
Measure for 4 weeks before changes to establish baseline KPIs.
Step 3: Create a Dashboard
Use spreadsheets or analytics tools to display KPIs daily/weekly:
- What's the actual value?
- Is it vs. target or benchmark?
- Is trend up or down?
- What's the confidence level (sufficient sample size)?
Step 4: Review & Act
Weekly reviews (not daily):
- Which KPIs are off-target?
- What operational changes would improve them?
- Test changes, measure impact
Step 5: Share with Team
Retail teams perform better when they understand metrics:
- "We're 5 customers short of daily target"
- "Conversion was 18% yesterday; 22% average"
- "Peak period was busier than forecast; great job handling the rush"
Conclusion
Retail success requires monitoring 10+ interconnected KPIs, not just revenue. Total footfall, conversion rate, ATV, dwell time, and other metrics reveal operational reality and guide improvements.
Start tracking the KPIs relevant to your business. Most retail managers should monitor:
- Total Footfall (traffic strength)
- Conversion Rate (sales efficiency)
- Average Transaction Value (transaction size)
- Sales Per Visitor (overall performance)
- Peak Hour Traffic (staffing needs)
- Dwell Time (engagement level)
- Staff-to-Customer Ratio (service capacity)
- YoY Growth (business momentum)
Implement a simple dashboard. Review weekly. Act on insights. Small improvements compound into dramatically better business performance.
Call to Action
Ready to start tracking KPIs effectively?
Download the Free KPI Dashboard Template – plug in your numbers and instantly visualize store performance against targets.
This template includes:
- 10 essential KPI tracker (daily/weekly view)
- Automatic benchmarking against industry standards
- YoY comparison calculator
- Trend analysis (flagging KPIs declining)
- Action items checklist (what to improve based on KPI gaps)
- Multi-location comparison (if you operate multiple stores)
[Download Free Dashboard] and start optimizing your store with data-driven KPI tracking.
Or [Schedule a consultation] to discuss which KPIs matter most for your business and how accurate footfall data enables better decision-making.
Hoxton Analytics provides AI-powered footfall counting and retail analytics. We help retailers track KPIs accurately and make data-driven decisions that improve conversion, increase sales per visitor, and drive growth.