From Online to Physical: A Shopify Merchant's Guide to In-Store Analytics
TL;DR — Key Takeaways
- You already know online analytics: Google Analytics, conversion rate, traffic sources, cart abandonment. These are second nature to you.
- Physical store analytics are different: You're now measuring footfall (people), not sessions. In-store conversion rate, not add-to-cart rate. Dwell time, not page bounce rate.
- The good news: Most online metrics have a physical store equivalent. You can replicate your online analytics stack for brick-and-mortar in 30 minutes.
- The minimum viable stack: Shopify POS + people counter + Google Analytics = complete picture.
- The most important metric to start with: In-store conversion rate (Visitors ÷ Transactions). Master this first, then add complexity later.
- Timeline: You'll have baseline data in one week, actionable insights in two weeks, optimization wins in four weeks.
Part 1: The Shopify Merchant's Journey — From Online to Offline
You started with Shopify online. You became expert at:
- Google Analytics: Tracking sessions, bounce rate, traffic sources
- Conversion rate: Monitoring % of sessions that became purchases
- Customer acquisition cost (CAC): Knowing how much each customer cost to acquire
- Cart abandonment: Hunting down lost sales in the checkout funnel
- Product analytics: Seeing which products your online customers prefer
You obsessed over these metrics. They drove your business. You optimized relentlessly.
Then you opened a physical store.
And suddenly, all that expertise became partially irrelevant.
Why Online Analytics Don't Translate Directly to Physical
The differences are subtle but critical:
| Metric | Online | Physical Store |
|---|---|---|
| What we measure | Sessions (visits to website) | Footfall (visits to store) |
| The conversion funnel | Product page → Cart → Checkout → Purchase | Store entrance → Browse → Checkout → Purchase |
| The friction points | Page load time, checkout complexity, shipping costs | Store layout, queue length, staff availability |
| Traffic sources | Google, social, email, paid ads | Google Maps, word-of-mouth, walk-bys, physical signage |
| Cart abandonment | Customers who added items but didn't buy | Customers who entered but didn't buy (invisible!) |
| Customer behavior data | Session duration, pages viewed, returning visitors | Time spent in-store, products touched, repeat visits |
See the pattern? Online, you measure behavior on screens. Offline, you measure behavior in physical space. The tools, KPIs, and optimization strategies are different.
Part 2: How to Replicate Your Online Analytics for In-Store
Let's translate your online analytics expertise into physical store expertise.
Online Metric: Google Analytics Sessions → Physical Metric: Footfall
What you know about online:
- Google Analytics shows daily/hourly sessions
- You track session growth week-over-week
- You note peak hours (when most traffic arrives)
- You correlate spikes with marketing campaigns
What you need for physical store:
- A people counter shows daily/hourly footfall
- Track footfall growth week-over-week
- Note peak hours (when most visitors arrive)
- Correlate spikes with marketing campaigns or in-store events
The translation:
- Online: "We had 1,200 sessions this week" → Physical: "We had 1,200 visitors this week"
- Online: "Peak traffic is Tue–Thu 2–5pm" → Physical: "Peak traffic is Tue–Thu 2–5pm"
- Online: "Friday email campaign drove 35% session spike" → Physical: "Friday email campaign drove 35% visitor spike"
Action: Install a people counter that tracks hourly/daily footfall. You already know how to interpret this data.
Online Metric: Conversion Rate → Physical Metric: In-Store Conversion Rate
What you know about online:
- Conversion rate = (Transactions ÷ Sessions) × 100
- You track it daily and compare week-over-week
- You A/B test to improve it (landing page changes, checkout optimization, etc.)
- A 1% improvement is worth thousands in extra revenue
What you need for physical store:
- Conversion rate = (Transactions ÷ Footfall) × 100
- Track it daily and compare week-over-week
- Test changes to improve it (layout, staffing, promotions, visual merchandising)
- A 1% improvement has the same revenue impact as online
The translation:
- Online: "Our conversion rate is 2.5%" → Physical: "Our conversion rate is 15%"
- Online: "We improved conversion from 2.5% to 2.8% (12% lift)" → Physical: "We improved conversion from 15% to 16.5% (10% lift)"
- Online: "A checkout optimization test netted +0.3% conversion, worth £2,000/month" → Physical: "A layout change netted +1.5% conversion, worth £1,500/month"
Action: Pair footfall data (from people counter) with transaction data (from Shopify POS). Calculate conversion rate automatically. Track weekly.
Note: Physical conversion rates are much higher than online (15% vs. 2–3%) because the barriers to entry are different. Online, a visitor is just a page view. Physical, a visitor is a person who chose to enter your store. Higher intent = higher conversion.
Online Metric: Traffic Sources → Physical Metric: Marketing-to-Footfall Attribution
What you know about online:
- Google Analytics shows "traffic sources": organic, paid, direct, social, email, referral
- You measure the ROI of each campaign (cost per acquisition, ROAS, etc.)
- You double down on high-ROI sources and pause low-ROI ones
What you need for physical store:
- Footfall data shows "total visitors" but doesn't automatically break down by source
- You manually map marketing campaigns to footfall spikes
- You estimate ROI (campaign cost vs. extra revenue generated by the spike)
- You optimize based on which campaigns drive footfall most efficiently
The translation:
- Online: "Our Google Ads cost £500 and generated 120 sessions at 2.5% conversion = 3 sales = 0.6% ROAS" → Physical: "Our Google Local Services Ad cost £100 and drove an estimated 30 extra store visits, ~4 sales = £200 profit = 2x ROAS"
- Online: "Email marketing is our best channel, 5% click-through rate" → Physical: "Email marketing drove a 40% footfall spike last Friday (email mentioned 'open late, 10% off')"
- Online: "Pause the cold outreach campaign (0.3% ROAS)" → Physical: "Pause the radio ad (footfall spike is insignificant relative to cost)"
The catch: Physical attribution is less precise than online (no pixel, no cookies, no UTM codes). But it's still valuable. Rough data beats no data.
How to do it:
- Run a marketing campaign (email, social, radio, local listing, etc.)
- Note the date, time, and message
- Watch your footfall data for a spike on that day/time
- Estimate: did this campaign drive an extra 30 visitors? 100 visitors?
- Calculate ROI: (Extra visitors × Conversion rate × AOV × Margin) − Campaign cost
Action: Use your people counter's dashboard to track footfall by date and time. Create a calendar noting all marketing campaigns. Manually correlate campaigns to footfall spikes weekly.
Online Metric: Cart Abandonment → Physical Metric: Walk-in Abandonment
What you know about online:
- Shopify Analytics shows "abandonments": customers who added items to cart but didn't complete checkout
- You follow up with abandoned cart emails
- You calculate the revenue impact (e.g., "20% of abandoned carts are recovered via email, worth £500/month")
What you need for physical store:
- You can't see inside a customer's head, but you can estimate: Visitors who entered but didn't buy are your "physical abandonment"
- If your conversion rate drops unexpectedly, something caused people to leave without buying
- You diagnose: Was a key item out of stock? Was the queue too long? Was staff overwhelming or absent?
The translation:
- Online: "600 sessions, 150 cart additions, 75 completed = 50% abandonment rate" → Physical: "300 visitors, 45 transactions = 85% 'abandonment' rate (i.e., walk-out without buying)"
- Online: "We recover 20% of abandoned carts via email, worth £500/month" → Physical: "We prevent 10% of walk-outs by training staff to offer help, worth £1,000/month in extra conversions"
The insight: Physical "abandonment" is much higher (85%) than online (50%). This is normal. People browse in-store without firm intent. But every percentage point you improve conversion has huge impact.
Action: When conversion rate drops below baseline, walk the floor. Diagnose what caused people to leave without buying. Fix it within hours, not days.
Online Metric: Product Analytics → Physical Metric: In-Store Behavior & Product Performance
What you know about online:
- Google Analytics shows: product page views, add-to-cart rate, conversion by product
- You know which products drive revenue and which are "browsers only"
- You use this to optimize product placement, prioritize inventory, and decide on promotions
What you need for physical store:
- Shopify POS shows: which products sold, transaction count, revenue by product
- You can't see "product page views" (people didn't visit a web page), but you can infer: if a product appears in 40% of transactions, it's popular
- You can't see exact browsing patterns, but high-end people counters show heatmaps (areas where people dwell)
- You use this to optimize layout, prioritize inventory, and decide on promotions
The translation:
- Online: "Blue jeans are our top product (8% of sessions view them, 35% convert to cart, 20% to purchase)" → Physical: "Blue jeans sell well (appear in 15% of transactions, but we have dwell time data showing people spend 8+ minutes in the jeans section)"
- Online: "Accessories have a 2% conversion rate (underperforming); let's improve product pages" → Physical: "Accessories rarely sell (appear in only 2% of transactions); let's move them to checkout for impulse buy placement"
- Online: "Product page load time is slow; optimize for better conversion" → Physical: "Sightlines to the back of the store are poor; people don't see products; let's improve lighting and signage"
Action: Use Shopify POS transaction data to identify best-selling and underperforming products. Use people counter heatmaps (if available) to see where people spend time. Cross-reference: do high-dwell areas have high-transaction products?
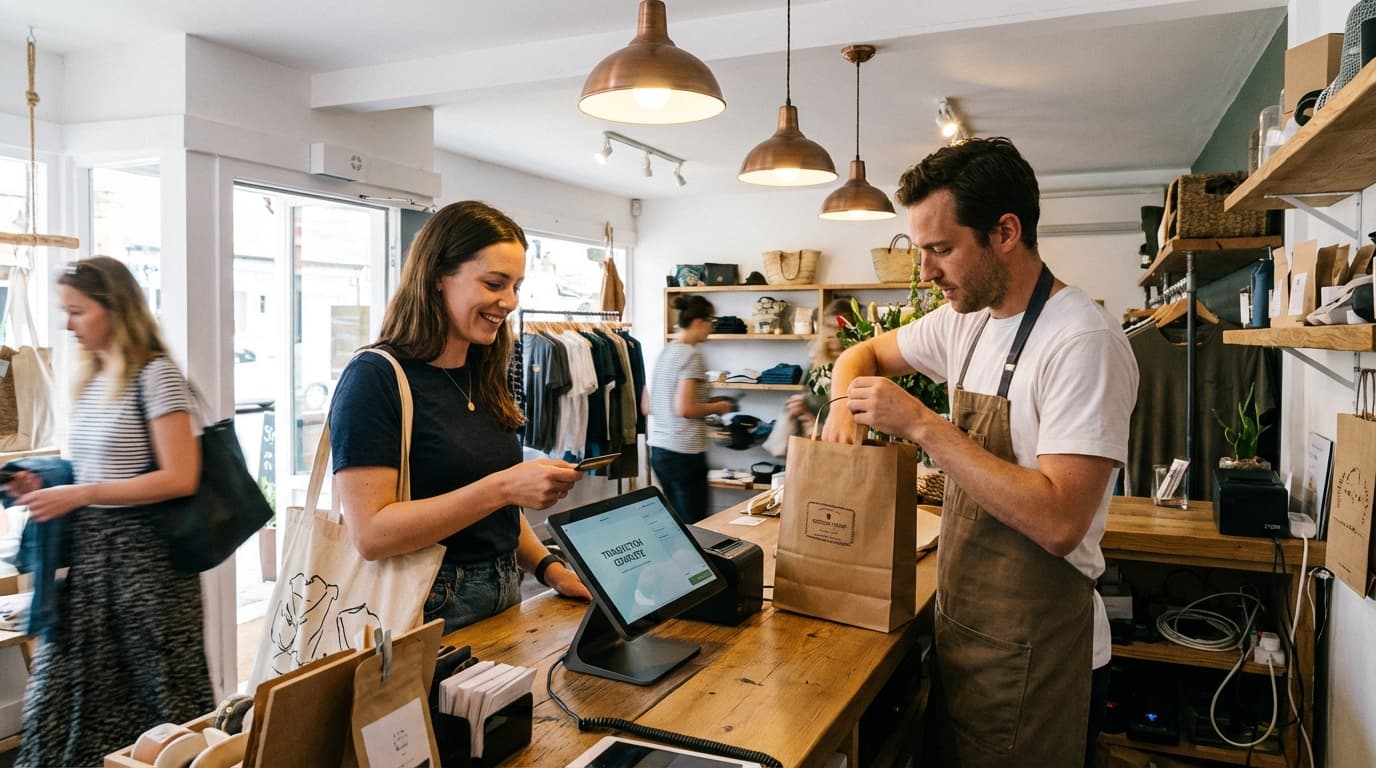
Part 3: The Minimum Viable Shopify Stack for Physical Retail
You don't need enterprise tools. Here's what works:
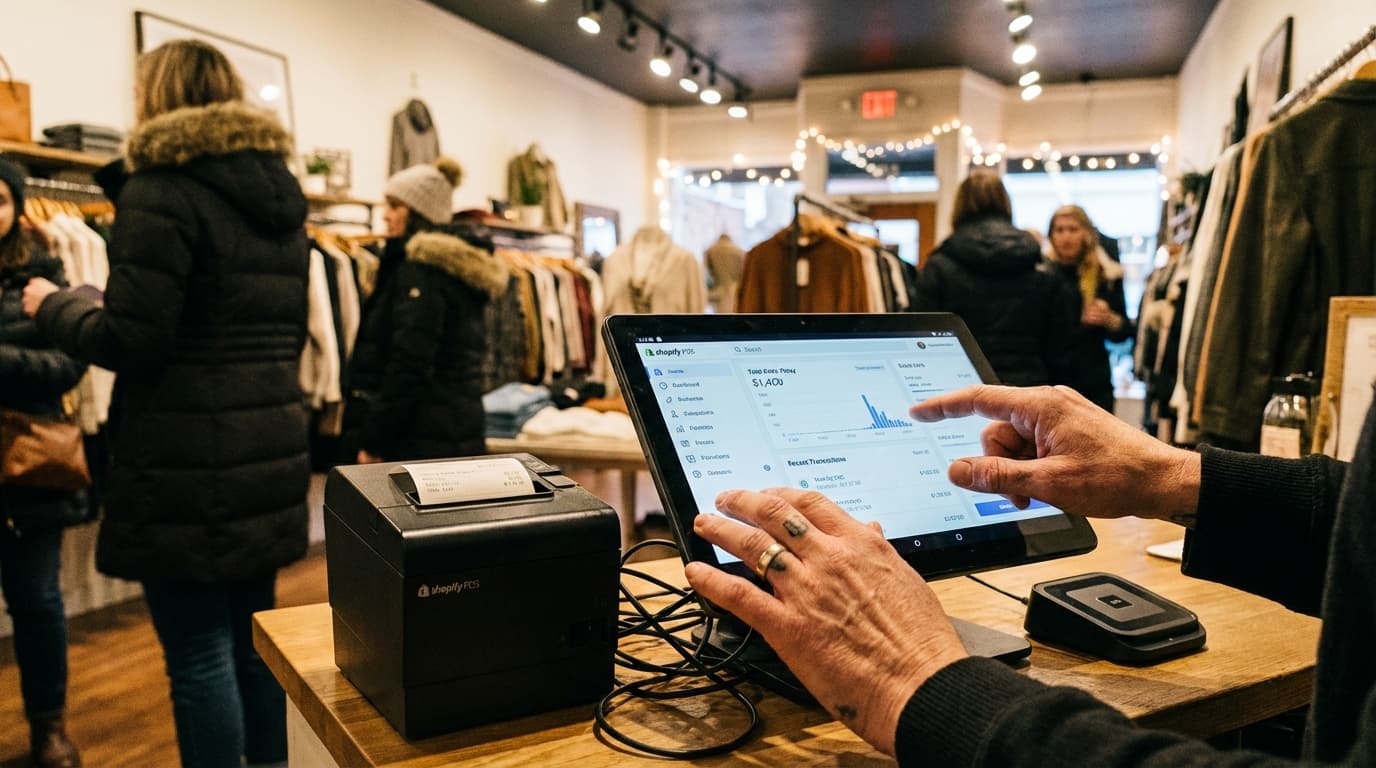
1. Shopify POS
What it does: Processes transactions, tracks staff, manages inventory, reports sales by product
Cost: £29–299/month
Your existing expertise: You already use this. It's identical to online Shopify, just in-store.
2. People Counter with Shopify Integration
What it does: Counts daily/hourly footfall, integrates with Shopify POS dashboard
Cost: £60–150/month (hardware usually included or leased)
My recommendation: Hoxton Convert (native Shopify app, 98% accuracy, 20-minute setup) or Dor (thermal sensor, cheaper, good accuracy)
Why: Native Shopify integration means footfall data appears directly in your Shopify dashboard alongside transaction data. One login, complete picture.
3. Google Analytics (Free)
What it does: Tracks online visitors and traffic sources
Cost: Free
Why keep it: If you're still running a website (even just a landing page), Google Analytics tracks online traffic. Cross-reference: Do Google Analytics sessions spike on the same days as store footfall? This tells you if online and offline customer journeys are aligned.
Total Stack Cost
- Shopify POS: £29–299/month
- People counter: £60–150/month
- Google Analytics: Free
- Total: £89–449/month for complete visibility into physical retail
Part 4: The One Metric to Master First — In-Store Conversion Rate
If you implement everything above, you'll have five key metrics:
- Footfall
- Conversion rate
- Revenue per visitor
- Product sales mix
- Marketing-to-footfall attribution
Master them in order. Start with conversion rate.
Why Conversion Rate First?
It's the single most important retail metric. Here's why:
- Online: A 1% conversion rate improvement is valuable but hard-won. Everyone is optimizing.
- Physical retail: Conversion rates are often neglected. You can gain 2–5% easily just by fixing obvious problems.
Example: You measure baseline conversion rate (15%). You notice it drops to 12% on Wednesdays. You walk the store on Wednesday and notice:
- Two staff members are out sick
- Queue is 15 minutes long
- A key product (jeans) is out of stock
- The fitting rooms are disorganized
You fix all three by hiring a temporary staff member and restocking. Conversion rate climbs to 16%. That's 1% improvement = at your footfall levels, ~15 extra transactions per week = ~£1,000 extra profit per month.
That's low-hanging fruit. Online, you'd never find such easy wins.
How to Master Conversion Rate
Week 1: Establish Baseline
- Install people counter
- Track footfall + transactions
- Calculate conversion rate for each day
- Write down the rate: "Our baseline is 15.2%"
Week 2: Diagnose
- Track hourly conversion (is it worse at certain times?)
- Track conversion by staff member (is one person closing sales better than others?)
- Walk the store at peak and slow times. Take notes on bottlenecks.
Week 3: Implement One Fix
- Pick the most obvious issue (long queue, poor layout, unhelpful staff, missing product)
- Implement a fix
- Measure conversion rate daily
Week 4: Evaluate & Iterate
- Did conversion rate improve?
- By how much?
- Was it worth the effort/cost?
- Pick the next fix and repeat
Part 5: What's Different (And What's Not)
What Stays the Same from Online
- Data obsession: You still care about metrics, tracking, and optimization
- Customer mindset: You still think about funnel optimization and user experience
- Testing mentality: You still test changes and measure impact
- ROI calculation: You still care about cost per acquisition and profit per customer
What Changes
| Aspect | Online | Physical |
|---|---|---|
| Barrier to entry | Low (click a link) | High (physically travel + enter store) |
| Conversion rates | 1–5% typical | 10–30% typical |
| Customer intent | Mixed (browsing, research, comparison) | Higher (already chose to visit your store) |
| Friction points | Website speed, checkout process, shipping | Store layout, queue length, staff courtesy |
| Time to optimize | Hours (deploy code) | Minutes to hours (rearrange layout, train staff) |
| Attribution | Precise (pixels, UTM codes) | Rough (footfall spikes vs. campaigns) |
Part 6: Month-by-Month Timeline
Month 1: Setup & Measurement
- Week 1: Install people counter, connect to Shopify POS
- Week 2: Establish baseline conversion rate, identify peak/slow hours
- Week 3: Diagnose top bottleneck (queue, layout, staffing, inventory)
- Week 4: Implement first fix, measure impact
Expected outcome: You now have baseline data and one proven optimization.
Month 2: Quick Wins
- Week 1: Implement fix #2 (usually staff training or product placement)
- Week 2: Implement fix #3 (usually layout adjustment)
- Week 3: Measure cumulative impact (conversion rate should be up 1–3%)
- Week 4: Plan fix #4 (usually based on heatmap or foot traffic data)
Expected outcome: Conversion rate improved 1–3%, generating £500–2,000 extra profit.
Month 3: Marketing Attribution
- Weeks 1–2: Run a test campaign (email, social, local ad)
- Week 3: Measure footfall spike caused by campaign
- Week 4: Calculate ROI and decide whether to repeat
Expected outcome: You've identified your best-performing marketing channel for driving physical visits (not just online clicks).
Month 4+: Scaling
- Build a playbook: "When conversion rate drops, do X"
- Train staff on optimization
- Plan seasonal campaigns with footfall data in mind
- Expand to multi-store tracking (if applicable)
Part 7: Common Traps for Online-First Merchants
Trap 1: "Our online conversion rate is 2%, so physical should be 2%"
Wrong assumption: Physical retail has a completely different baseline.
Reality: Physical conversion rates are 5–15x higher than online because people have already chosen to visit your store. Lower intent online (just browsing the web) vs. higher intent offline (took time to travel and enter).
Fix: Set physical conversion rate targets at 10%+ (depending on category). Don't expect online-level metrics.
Trap 2: "We don't need a people counter; we can estimate footfall"
Why this fails: You can't estimate. You'll guess wrong, your whole analysis will be wrong, and you'll make bad decisions.
Reality: A people counter costs £60–150/month. If it helps you avoid one bad decision (like overstocking when foot traffic is actually declining), it pays for itself in days.
Fix: Install a people counter in week 1. This isn't optional.
Trap 3: "We'll track everything and optimize later"
Why this fails: "Later" never comes. You'll collect data and never act on it.
Reality: Start with one metric (conversion rate) and master it before adding complexity.
Fix: Commit to one optimization per week for the first month. Small actions, big impact.
Trap 4: "Online and offline customer journeys are separate"
Why this is partly wrong: Yes, they're different. But they're also connected.
Reality: A customer might see a Google Ad online, then visit your physical store 3 days later. A person walks past your store physically, then visits your website to check hours/inventory. These journeys overlap.
Fix: Track both Google Analytics (online) and people counter (offline). Look for correlations. For instance, if you notice that social media spikes always precede store visits 24 hours later, you've found product-market fit for that channel.
Part 8: The Mindset Shift
You've spent years obsessing over online metrics. That discipline serves you now, but the metrics change:
- From: "How do we improve our online conversion rate?"
- To: "How do we improve our in-store conversion rate?"
- From: "Where is our online traffic coming from?"
- To: "Which marketing campaigns drive physical store visits?"
- From: "What's our cart abandonment rate?"
- To: "What's our store abandonment rate, and why do people leave without buying?"
The methods are the same (test, measure, optimize). The KPIs are different.
Part 9: Next Steps — Your First 30 Days
Week 1
- Choose a people counter (see comparison guide)
- Install hardware (15–30 minutes)
- Connect to Shopify POS (5 minutes, automatic via app)
- Take a baseline reading: "Today we had X visitors and Y transactions"
Week 2
- Track daily visitor count + conversion rate
- Note peak hours and slow hours
- Review Shopify POS data for products that sell most
- Walk the store at peak hours and note bottlenecks
Week 3
- Pick one bottleneck to fix (queue, layout, staffing, etc.)
- Implement the fix
- Measure daily conversion rate again
Week 4
- Compare conversion rate (week 4 vs. week 2)
- Calculate revenue impact
- Decide: repeat this fix at other locations? Or move to next fix?
Related Reading
- How to Track In-Store Conversion Rate with Shopify POS (2026 Guide)
- Shopify POS Analytics: 5 Physical Store Metrics You're Missing
- Best People Counters for Shopify Stores — 2026 Comparison
- Hoxton Convert: Shopify People Counter
Ready to Bring Your Online Expertise to Physical Retail?
You already know how to optimize online. Physical retail uses the same principles—just different metrics. Start tracking in-store conversion rate and watch your physical store performance transform.
Hoxton Convert installs in 15 minutes and connects your footfall data directly to Shopify POS.
Last updated: February 2026