HoxtonAi Live Event Intelligence
We capture the story
behind the stats.
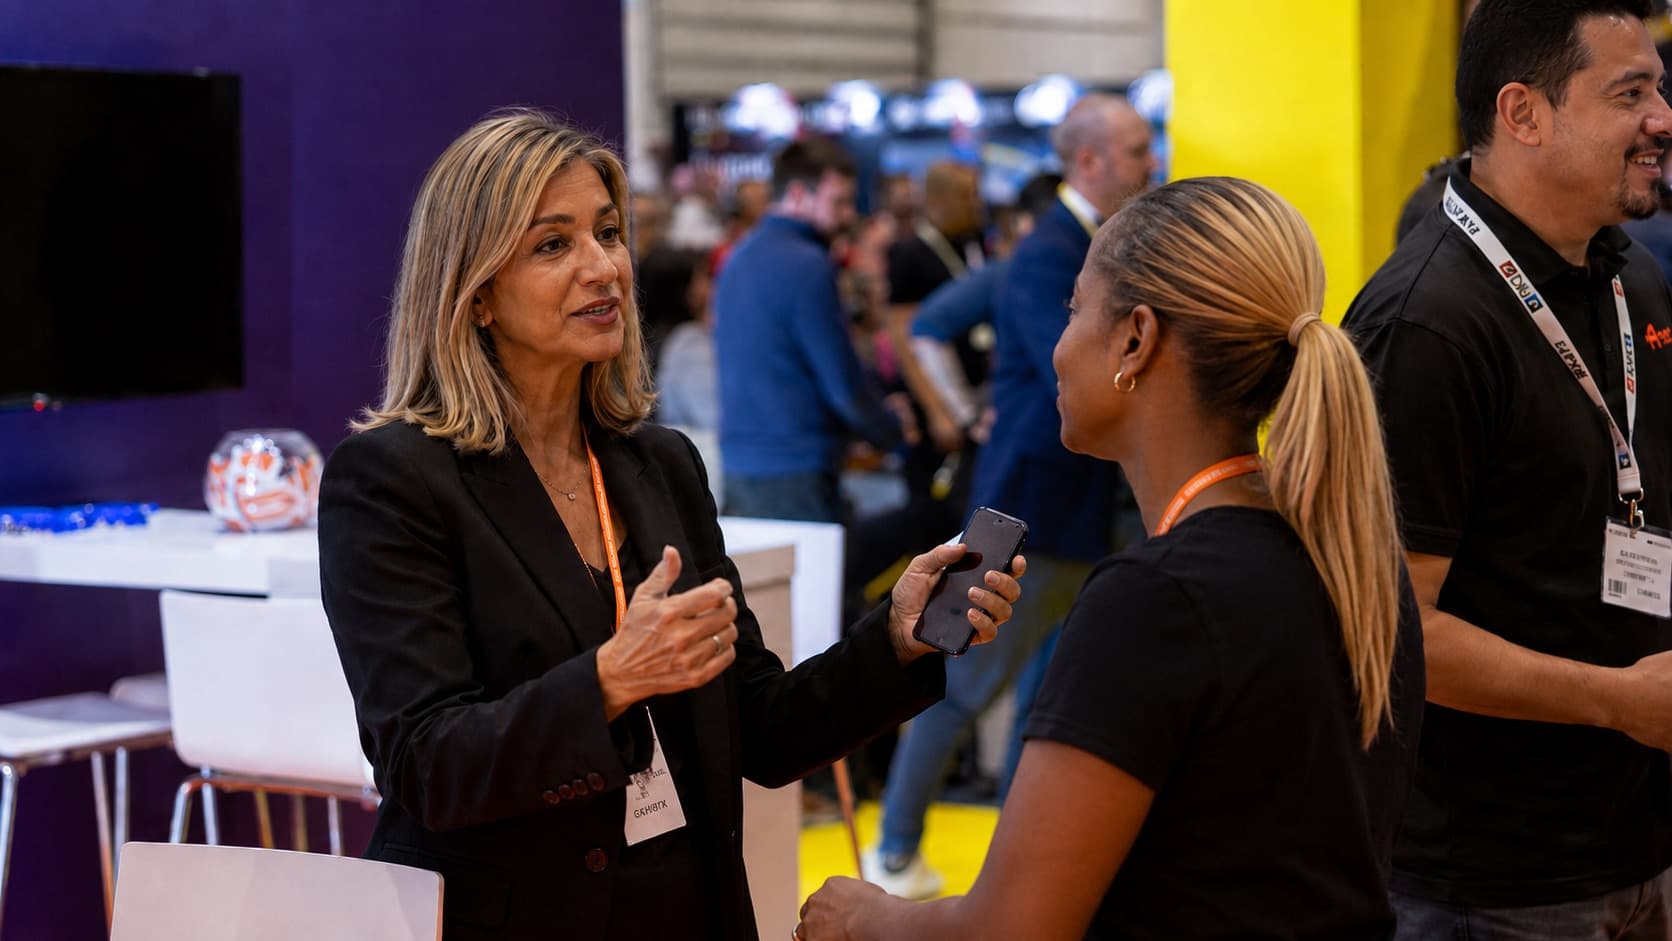
Spoken interviews and structured questions, collected from attendees and exhibitors on your event floor while the event is running.
We turn up, do the research and produce the report. Initial findings arrive as fieldwork closes; the full report follows within one to two weeks.
Powered by Hoxton SaySo
Every conversation connects › who they are › what they scored › what they said › why they feel that way › what they intend to do
Up to 50,000
words of spoken feedback
2,500+
linked quantitative data points
Multiple
audience segments, analysed separately
Live
adaptation of questions as themes emerge
Illustrative managed engagement. Volumes vary according to event size, duration and research design.
Conventional event feedback
The problem with post-event surveys
Most organisers measure the event with a form emailed out a few days after it ends. This is what tends to come back.
Very few replies
Only a small share of attendees fill it in, so the whole picture rests on a handful of answers.
The wrong mix of people
The people who do reply tend to be the very happy and the very annoyed. Everyone in between says nothing.
Heavy on ticks, light on why
Most of the form is ratings and multiple choice. The one open comment box gets a few words, if anything.
Asked too late
By the time it arrives people have been back at work for days, and no longer remember the detail.
A typical post-event survey
Form fill
Fixed survey questions
95%
- Full name
- Email address
- Company / organisation
- Job title
- How did you hear about us?
- EmailSocialColleagueOther
- First time attending?
- YesNo
- Overall rating
…and 6 more questions
Any other comments
5%
Left blank, or a few words
Live Event Intelligence
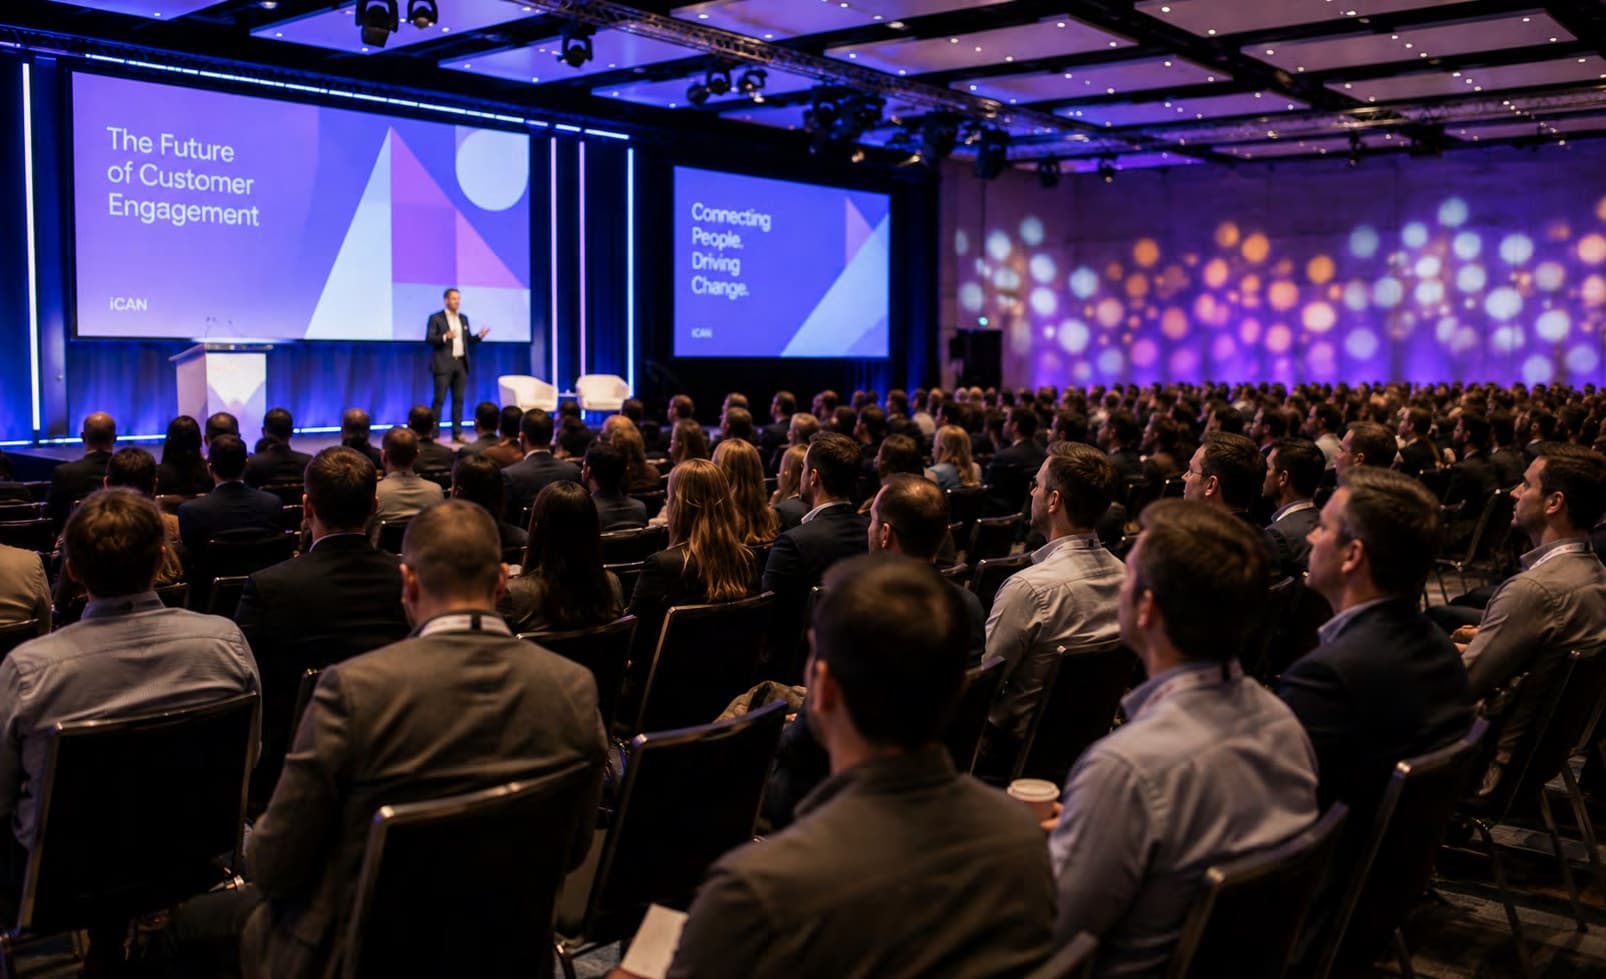
The answer: Hundreds of conversations, captured on the floor
Spoken interviews and the structured answers that go with them, gathered while the event is still happening — then transcribed, coded and compared by audience.
70
pages of analysis
250
interviews
35,000
words transcribed
2,000+
questions answered
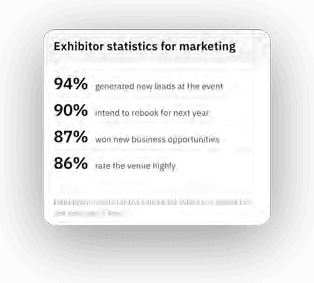
97%
would return next year
80%
left with a new lead
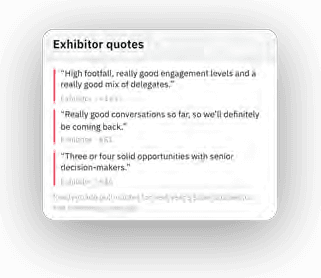
“Absolutely amazing — the best-run event we've been to this year.”
— Attendee, retail brand
“We closed a new partnership off the back of one conversation.”
— Exhibitor
NPS +62
promoter score
9.2/10
average speaker rating
The HoxtonAi difference
We collect and transcribe the whole conversation — rich feedback, not a one-line comment.
Both of these take about thirty seconds of an attendee’s time.
A typed survey box
Snapshot
“Good event. Enjoyed it. 7/10.”
A rating, stripped of context.
~30 sec
to log on and type — one throwaway line
Spoken, in the moment
Open, natural conversation
95%
“Honestly one of the better panels I’ve been to — really practical, not just theory. I came mainly to network and I’ve already picked up two solid contacts, so it’s paid off. One thing though: the main room got too warm after lunch and it was hard to hear at the back. I’ll definitely be back, and I’d love more hands-on workshops and a few more first-timers in the mix next year.”
Three quick quant taps
5%
NPS
Tap 0–10
Return?
Yes / No
More of?
Pick topics
~30 sec
to speak — five signals from one answer, plus the numbers
Method
How the survey data is collected
Each intercept produces two linked records from the same person: a transcribed open conversation, and a small set of structured quantitative answers.
Open conversation
A researcher and an attendee have an open, spoken exchange on the event floor, transcribed in full as they speak.
Structured questions
The same respondent then taps through a short set of quantitative answers — under 30 seconds, no typing.
Analysis and reporting
Transcription, theme coding and segment comparison land in the organiser's dashboard while the event is still on.
One conversation, connected
- Who they are
- Buyer · returning delegate
- What they scored
- NPS 9 · will return
- What they said
- “Keynote was the standout…”
- Why they feel it
- Practical content · two solid leads
- What they intend
- Rebook next year
Not a static survey. A live research programme that learns as the event unfolds.
Beyond the questionnaire
Answering questions that were never on the form
“What did people think of the speakers this year?”
Traditional post-event survey
Data not available
This question wasn’t on the form, so the answer was never collected.
Speaker question asked of 0 of 14 respondents
HoxtonAi
Answered from 83 conversations
Speakers were a clear highlight — mentioned in just over half of all conversations, and 81% of those were positive. The keynote drew the strongest praise for being practical and well-paced, while the afternoon panel came up most often as a weak spot — several people wanted a stronger chair and more debate.
81%
positive on speakers
44
mentioned a speaker
Keynote
most praised session
Illustrative comparison. Because every conversation is stored as natural language, new questions can be put to the evidence long after fieldwork has finished.
Example engagement
What one two-day engagement produced
At a recent two-day event at ExCeL London, HoxtonAi delivered a detailed evidence base for reviewing the event and planning its next edition.
501
questionnaire responses
250
transcribed interviews
35,000
spoken words of conversation
2,000+
structured questions answered
70
pages of analysis and appendices
The research covered
“This felt very different to a standard post-event survey. HoxtonAi captured what attendees and exhibitors were actually saying on the show floor, at a level of depth we wouldn’t normally get. Not just scores, but the reasons behind them and the opportunities for us as organisers.”
Vanessa Goddess
Quartz Media
What the organiser receives
From individual comments to a clear view of the whole event.
Live capture and an immediate event summary come with every plan. The deeper post-event report is part of the managed service.
Live
During the event
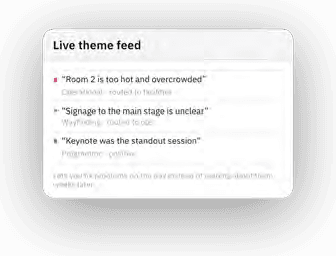
- Individual responses
- Sentiment
- Emerging themes
- Alerts
- Response volumes
Self-serve & managed
Rapid summary
Within days
- Headline findings
- Strongest positives & negatives
- Audience quotes
- Emerging priorities
Self-serve & managed
Deep analysis
The full report
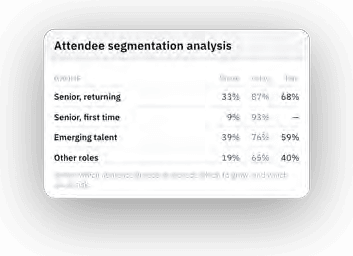
- Segment comparisons
- Correlations
- Attendee & buyer types
- Intent analysis & theme coding
- Considerations for next time
Managed service only
A typical managed engagement
- 1
6–8 weeks before
Objectives, audiences and measures agreed
- 2
2 weeks before
Questionnaire finalised, researchers briefed
- 3
Event days
Fieldwork on the floor, live monitoring
- 4
Immediately after
Initial findings and notable themes
- 5
1–2 weeks after
Full analysis, evidence and recommendations
FAQs
What the research covers, how it runs, and what you get back.
Make the next event better informed
Tell us what you are trying to understand, which audiences matter and which decisions the research needs to support. We will recommend a research design, fieldwork plan and reporting scope for your event.